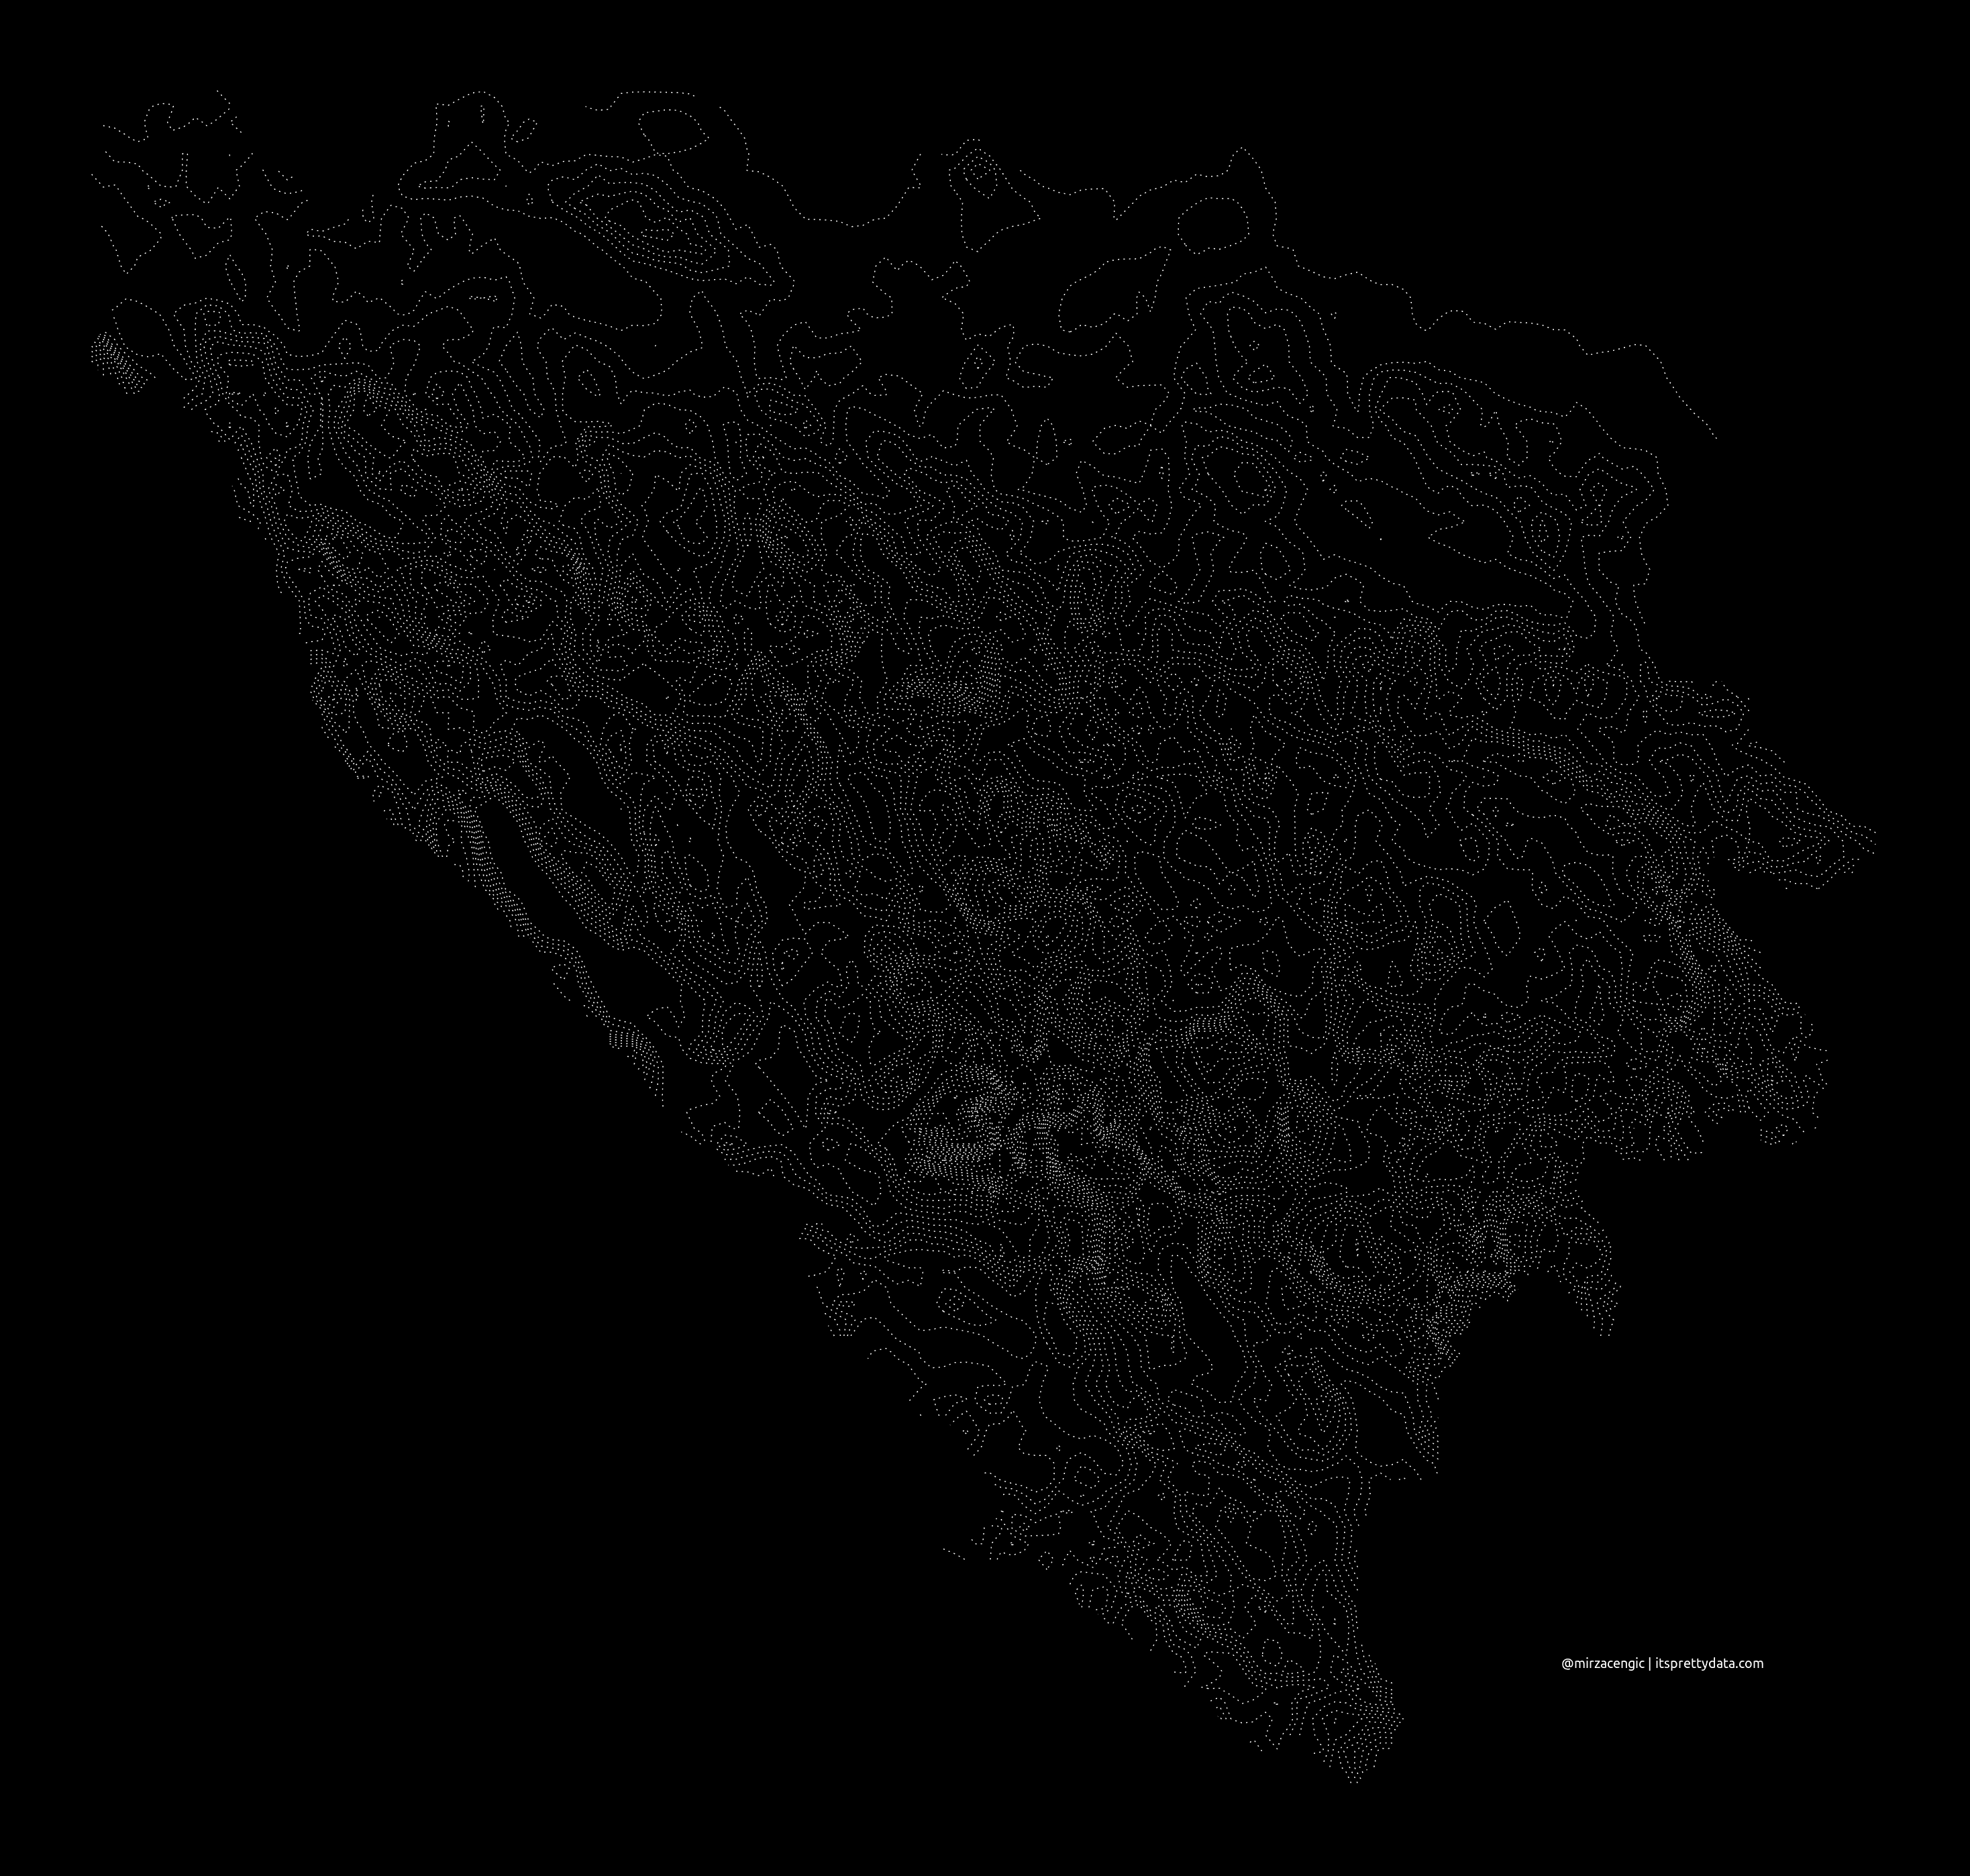
#30DayMapChallenge is an initiative started on Twitter by Topi Tjukanov. The aim of the challenge is to create a map each day of the month on a given theme. Below are some of my contributions to the challenge. I usually choose whatever tool is appropriate for the vizualization task, but for this challenge I limited myself only to using ggplot2 so I can learn more about its mapping capabilities.

Day 1: Points
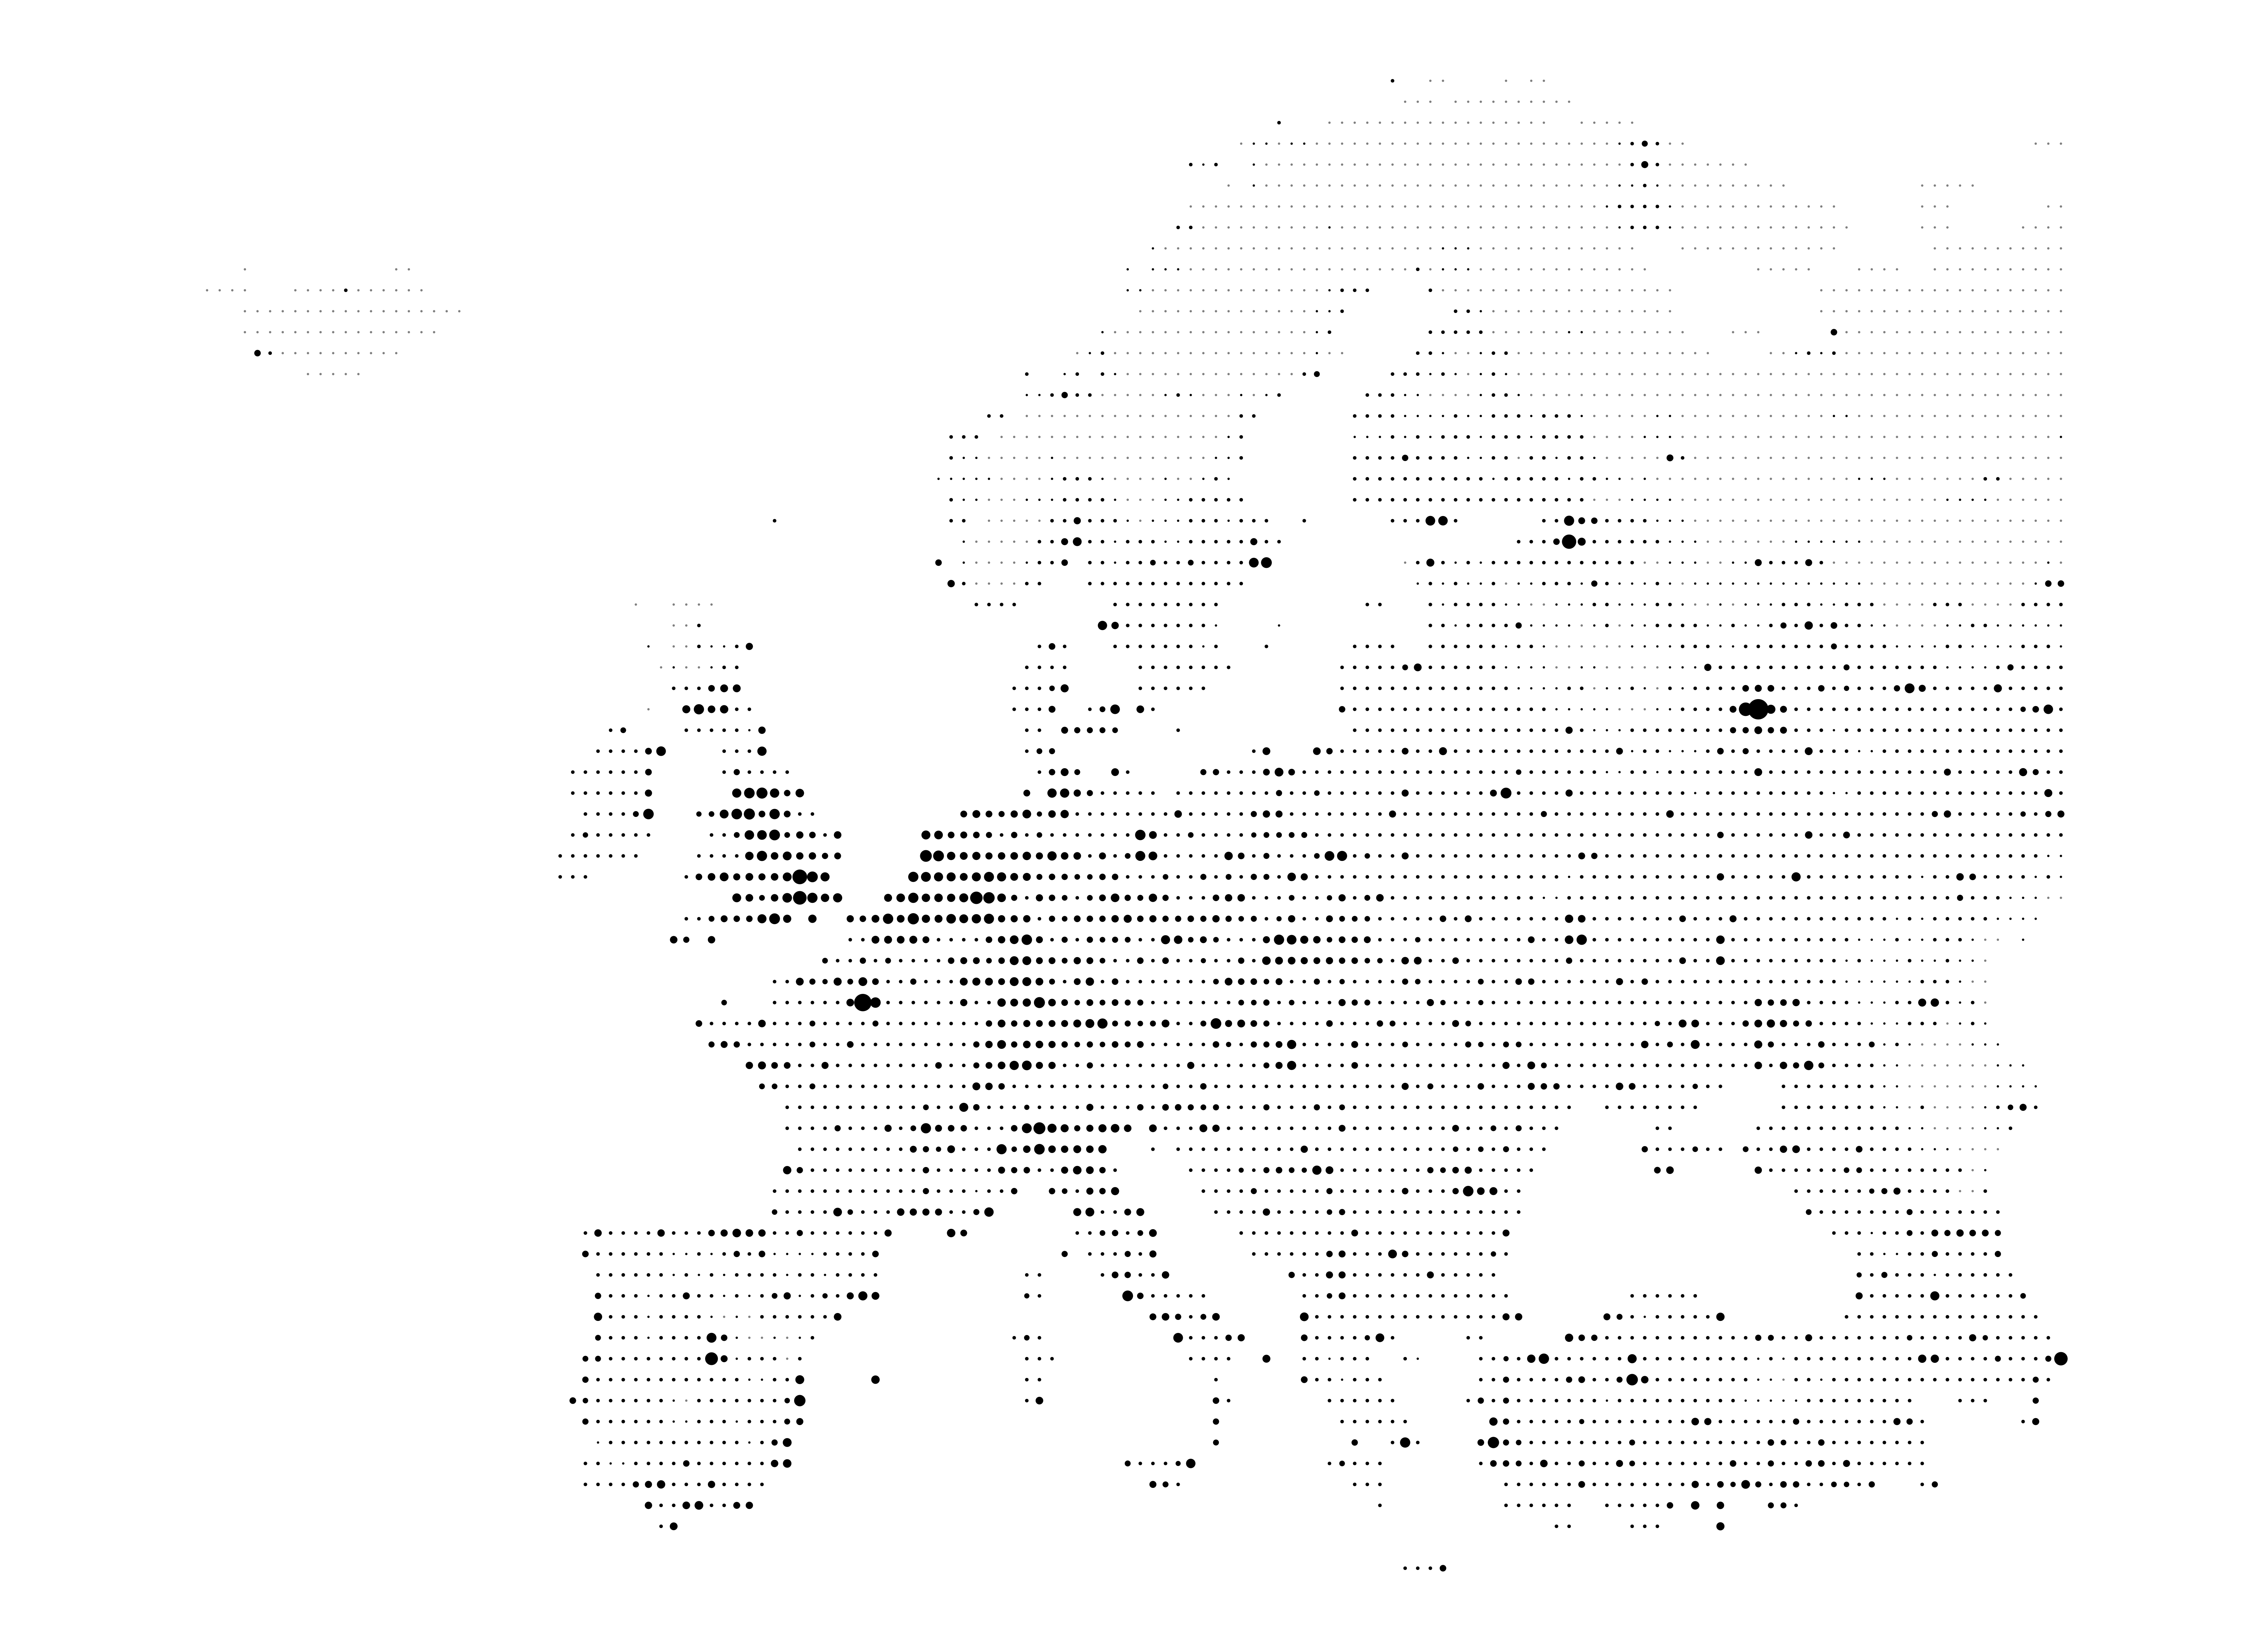
Day 2: Lines
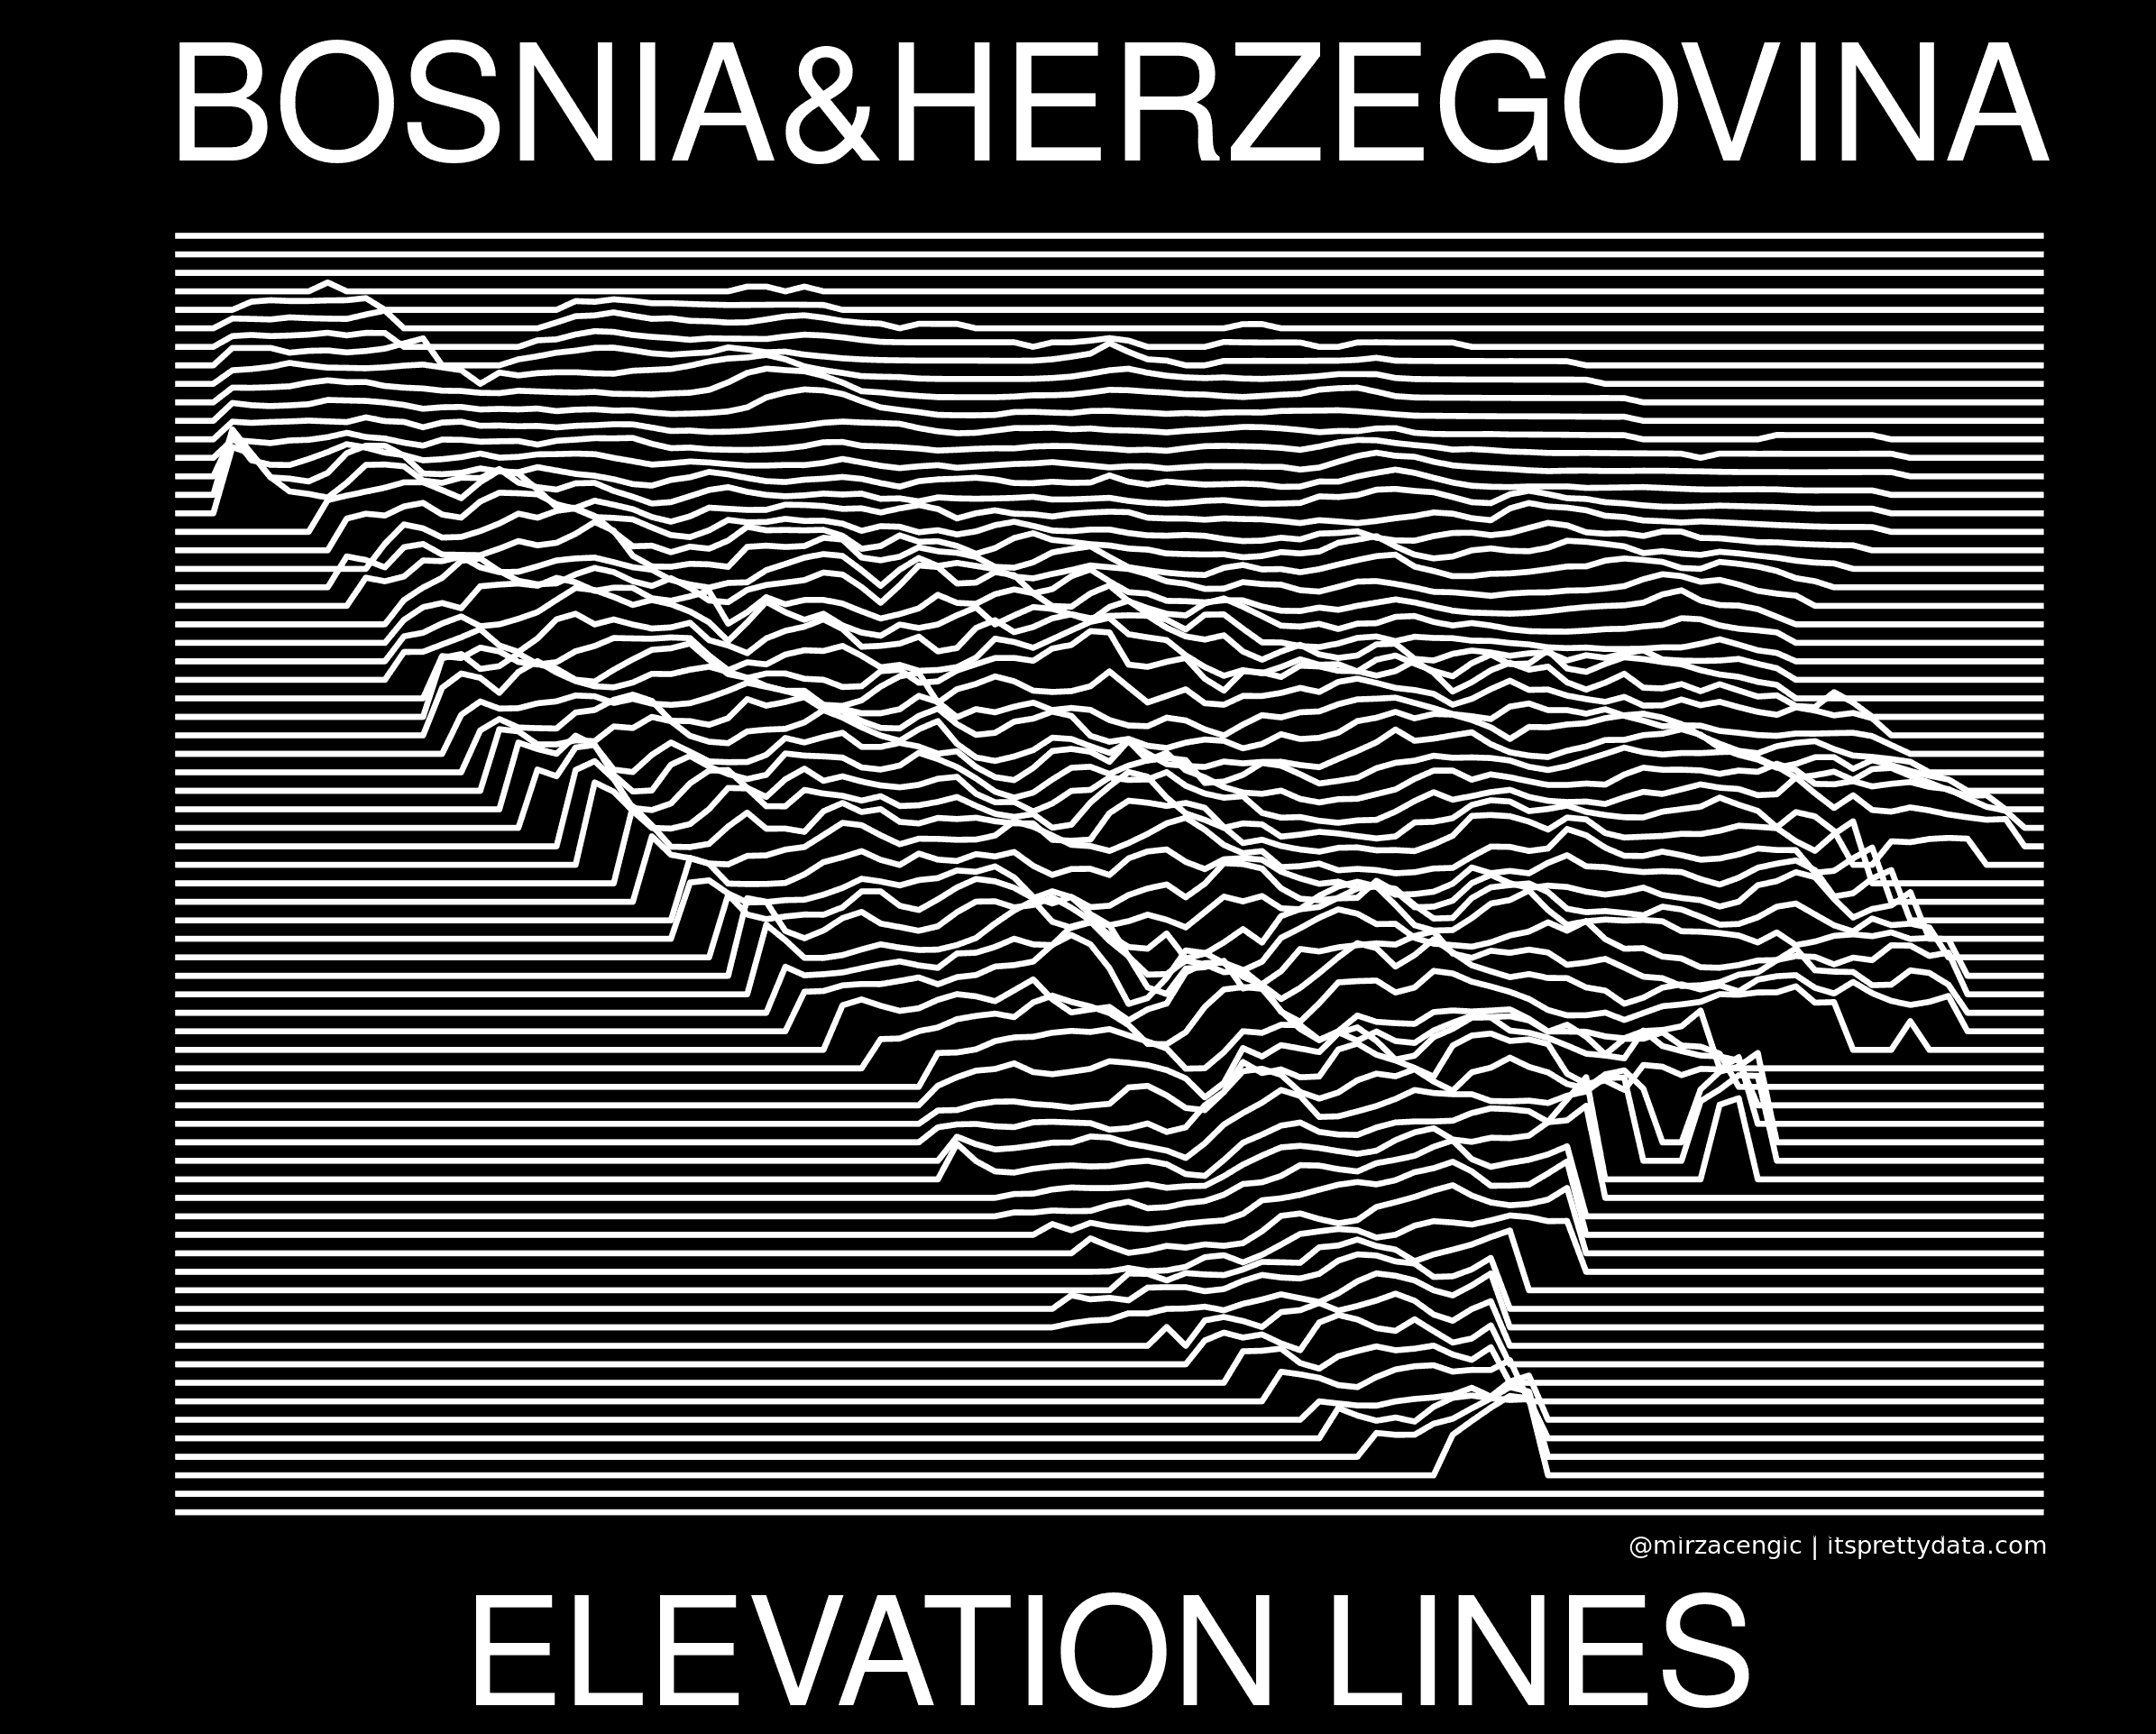
Day 3: Polygons
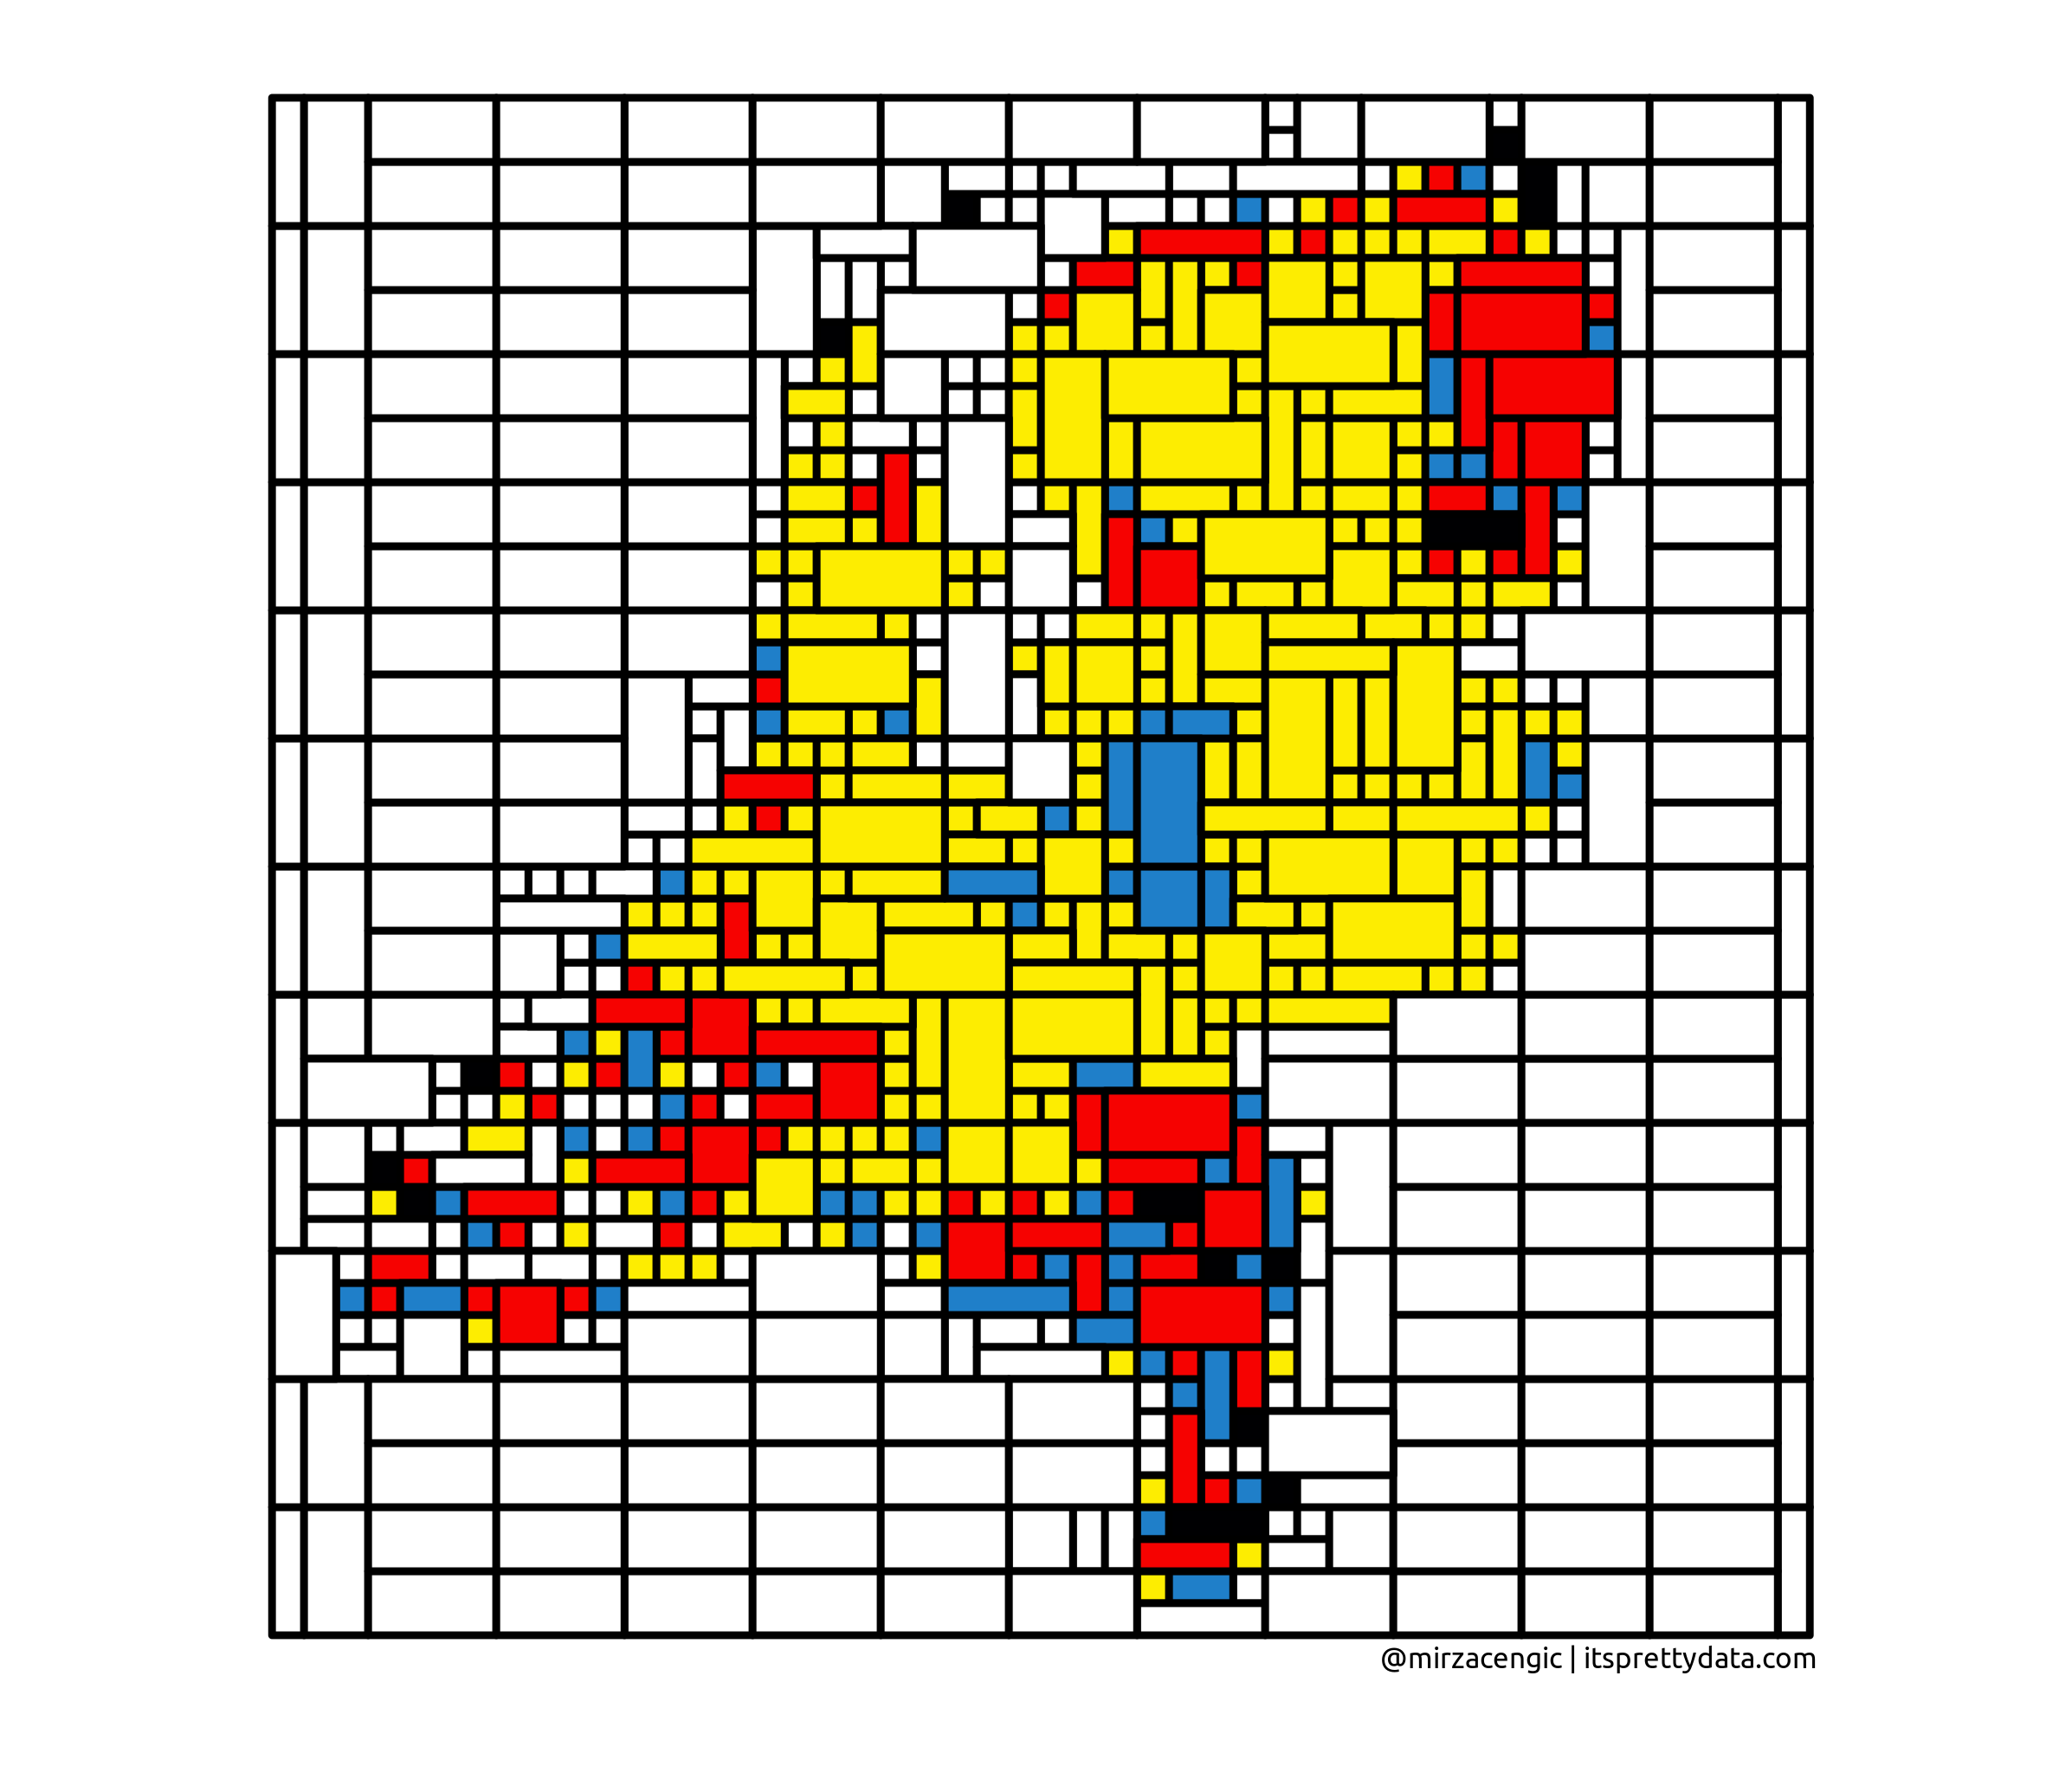
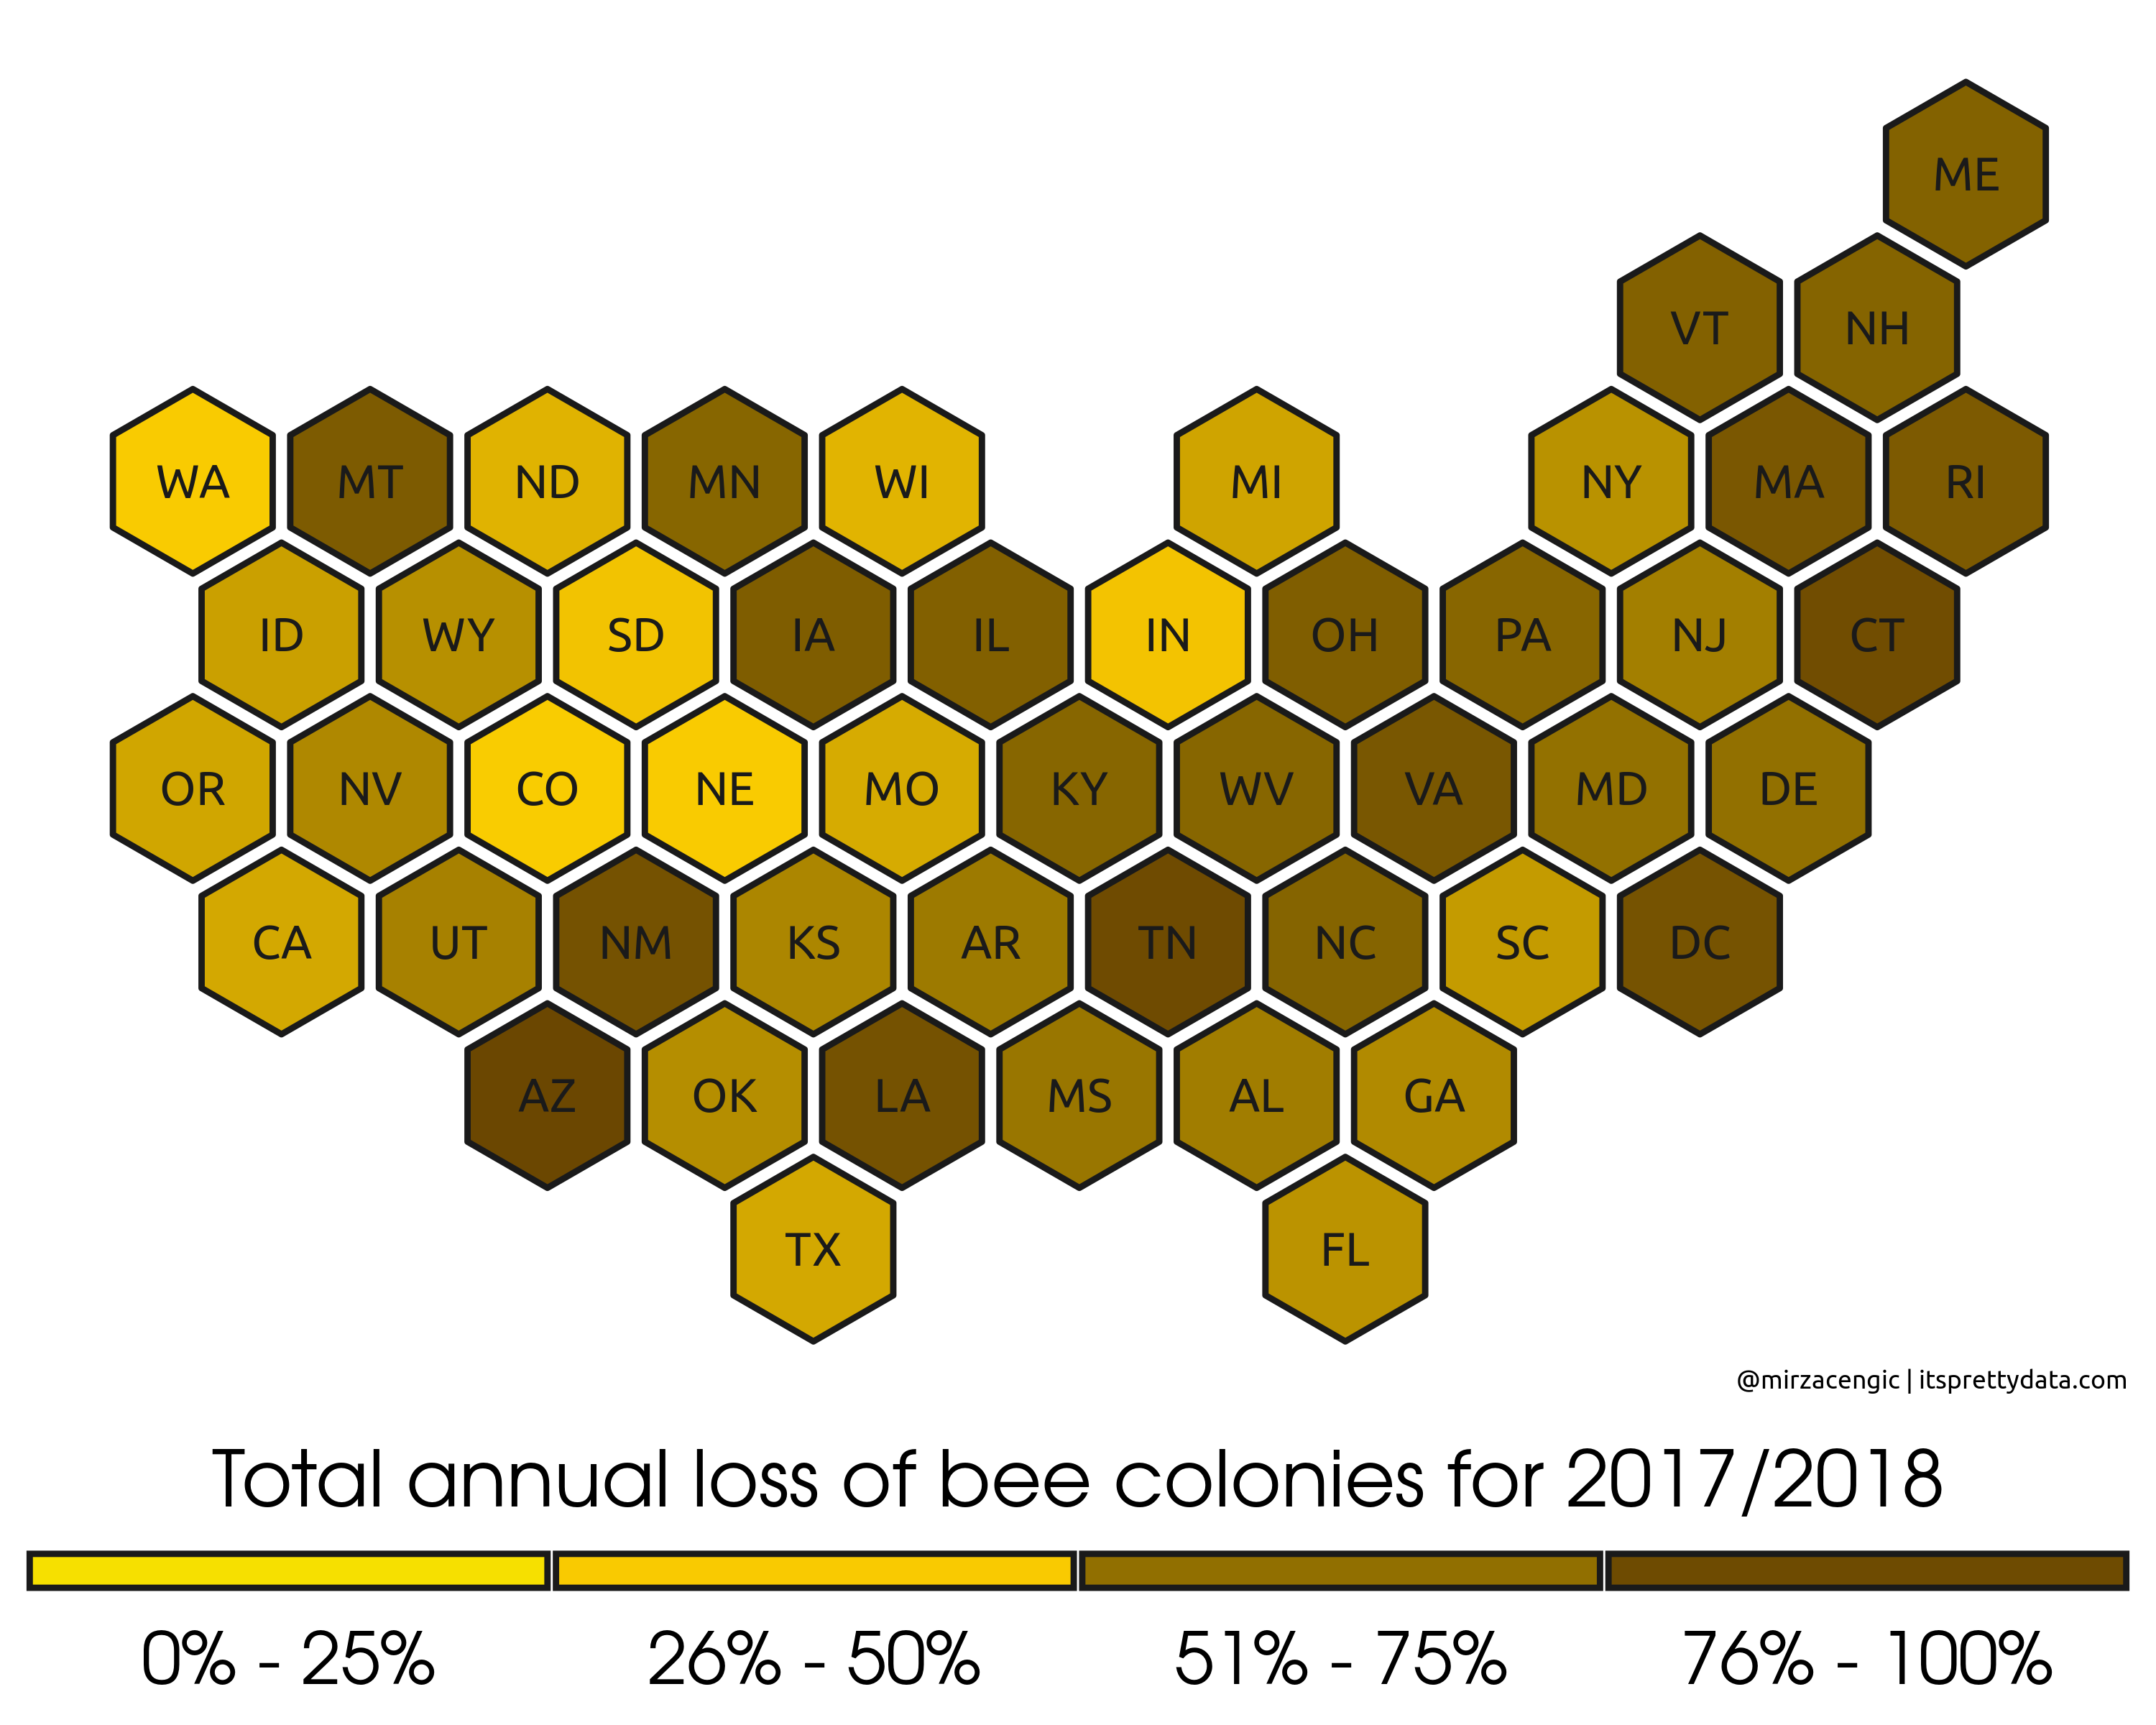
Day 4: Hexagons
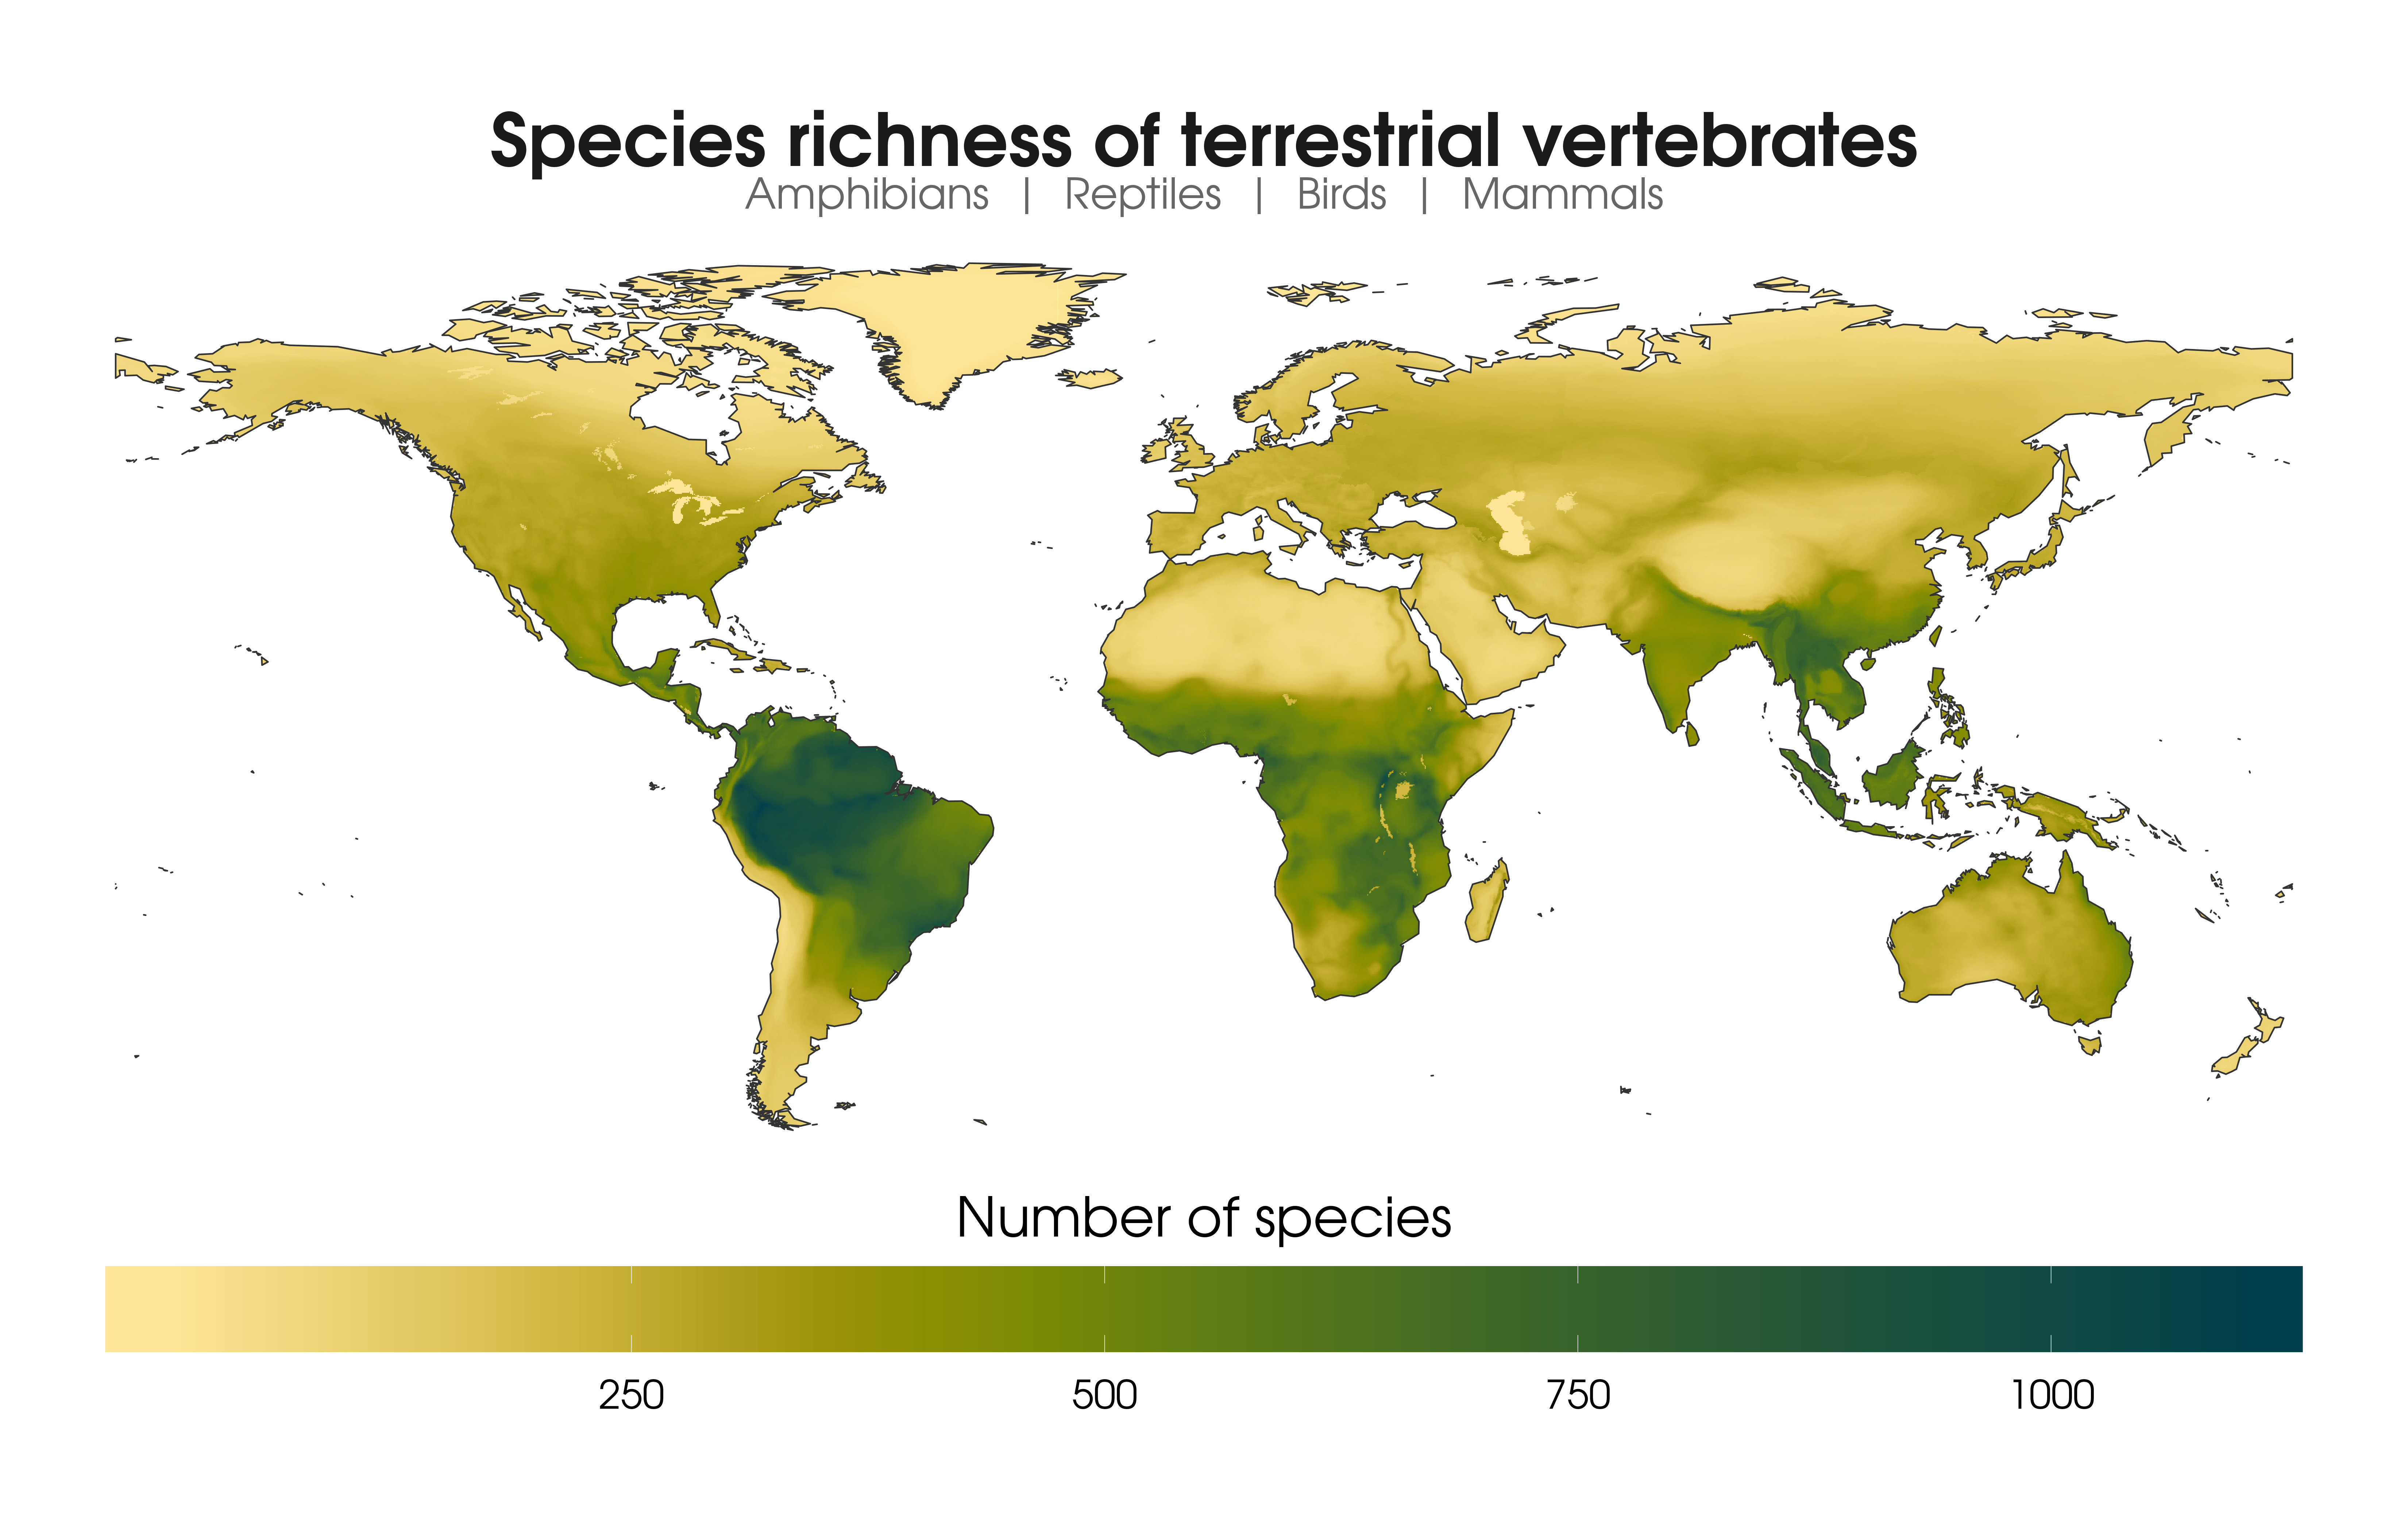
Day 5: Raster
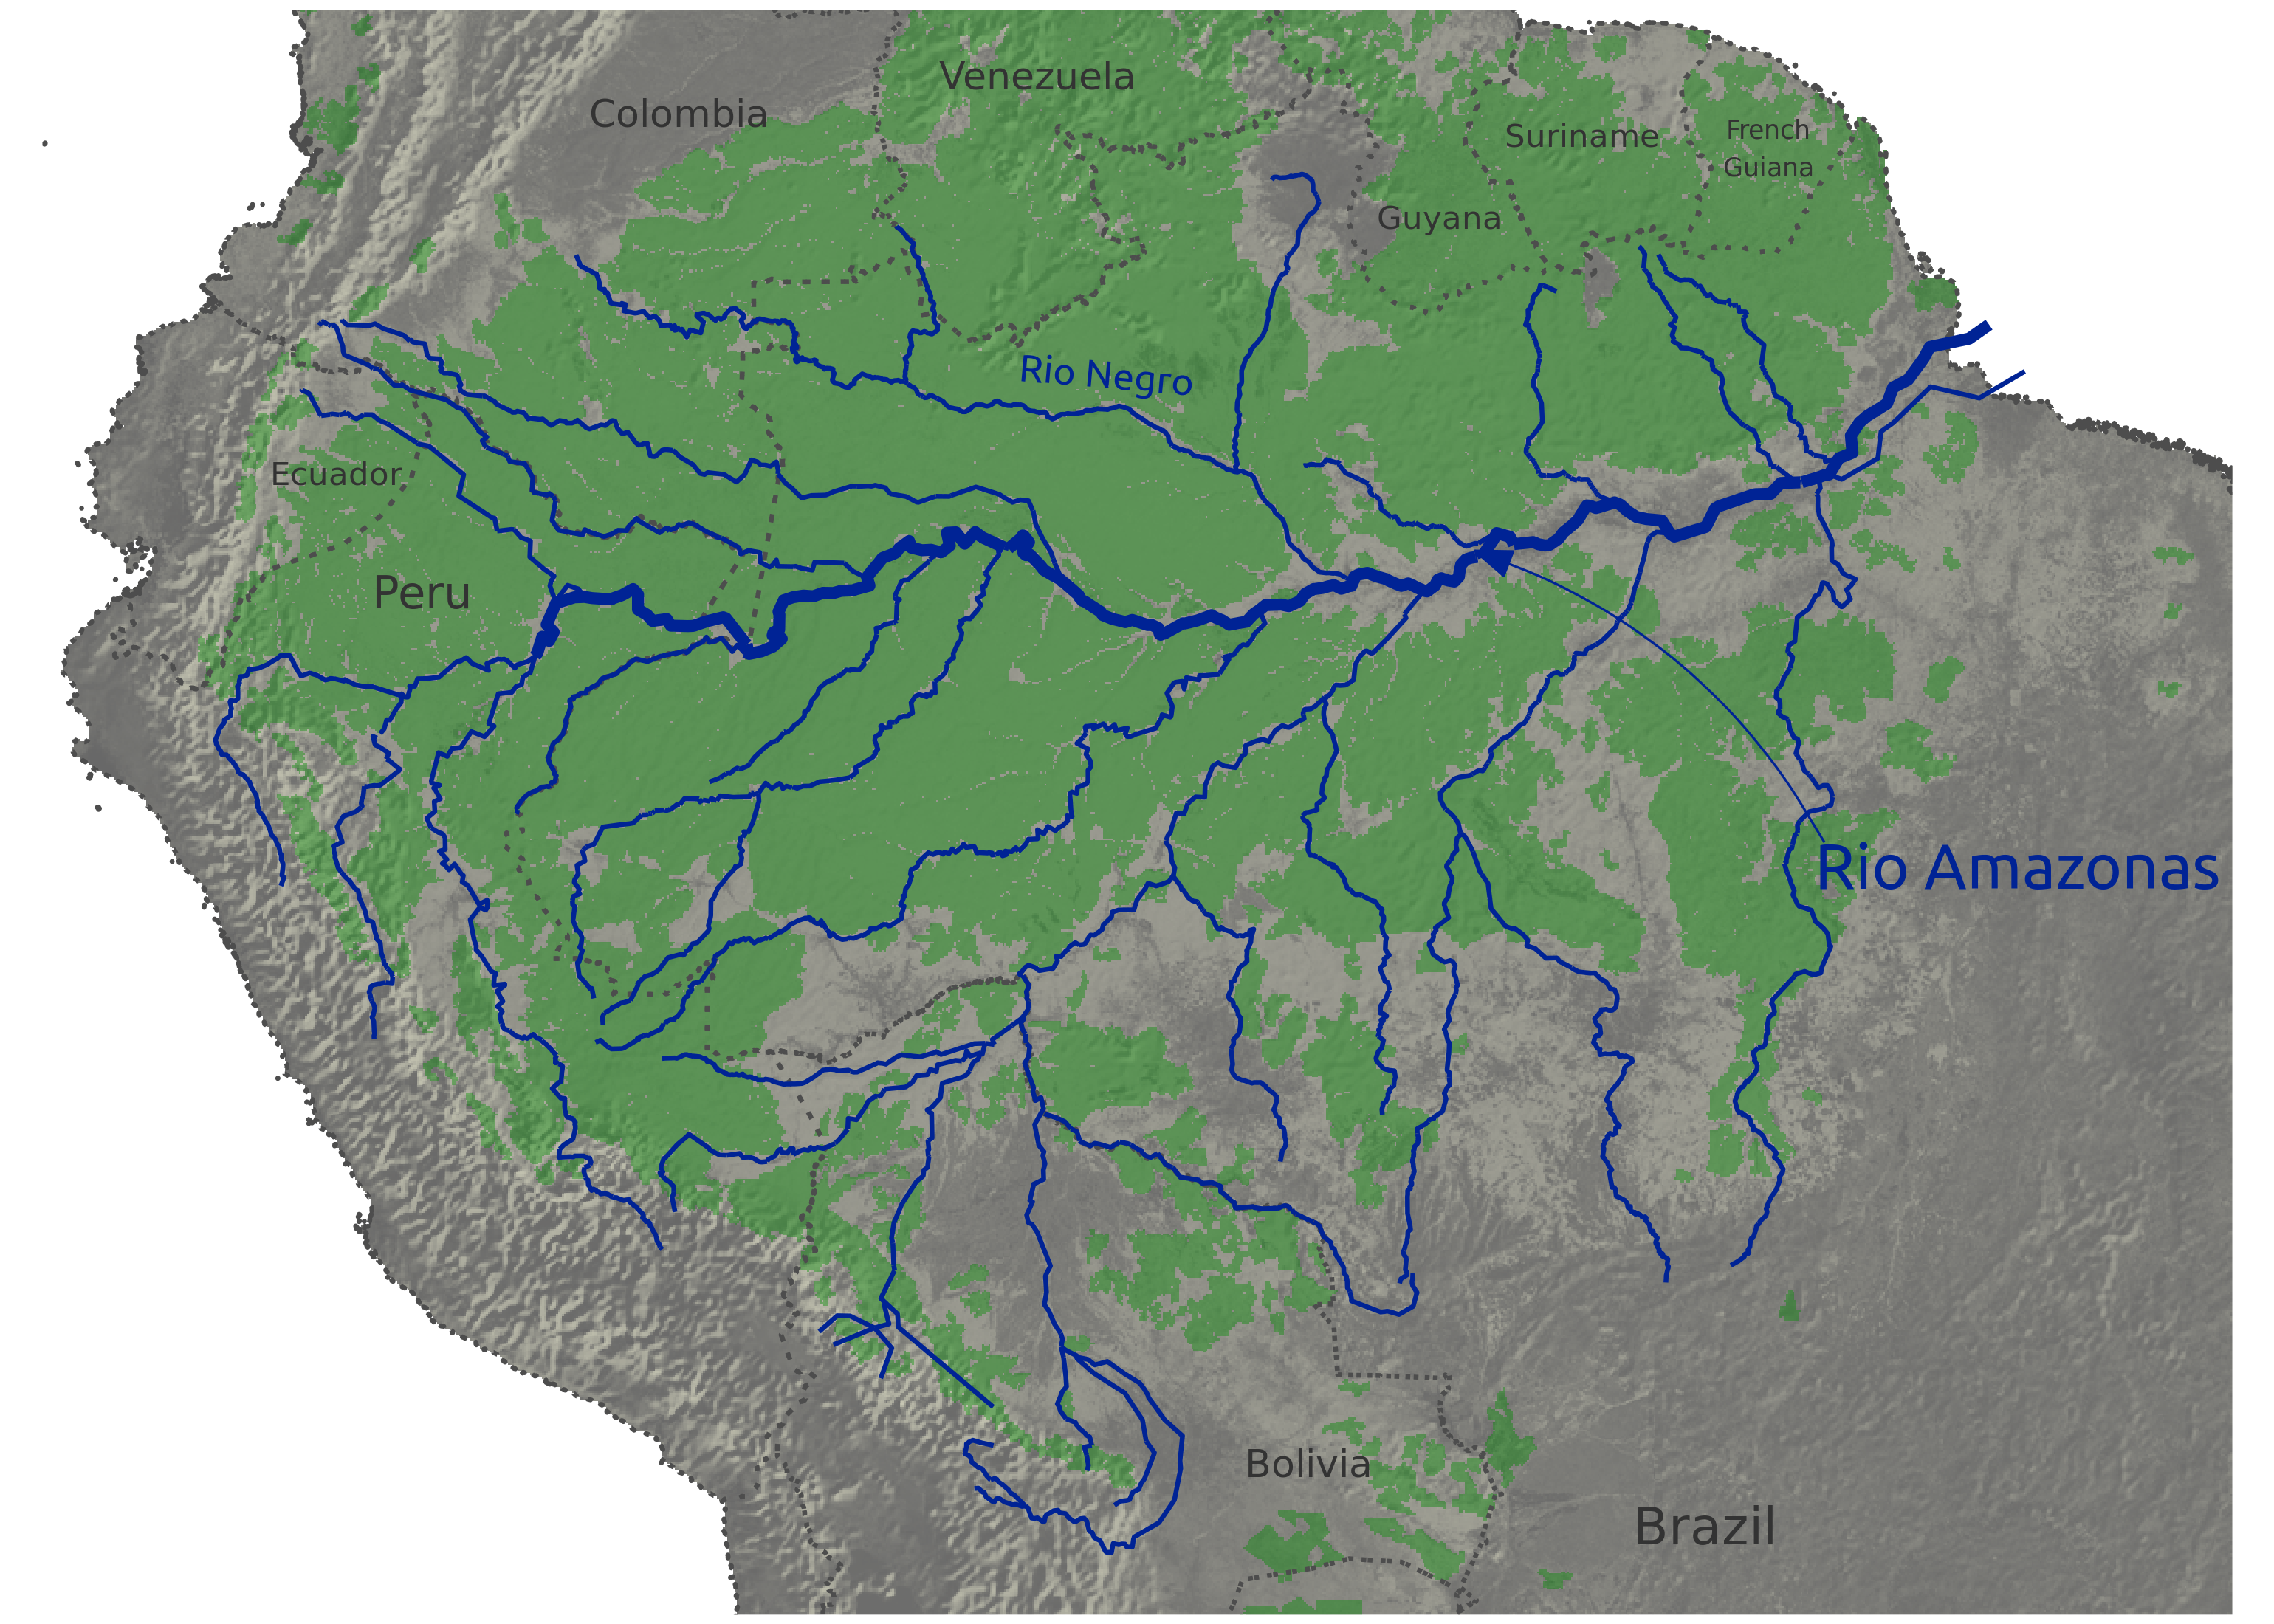
Day 6: Blue
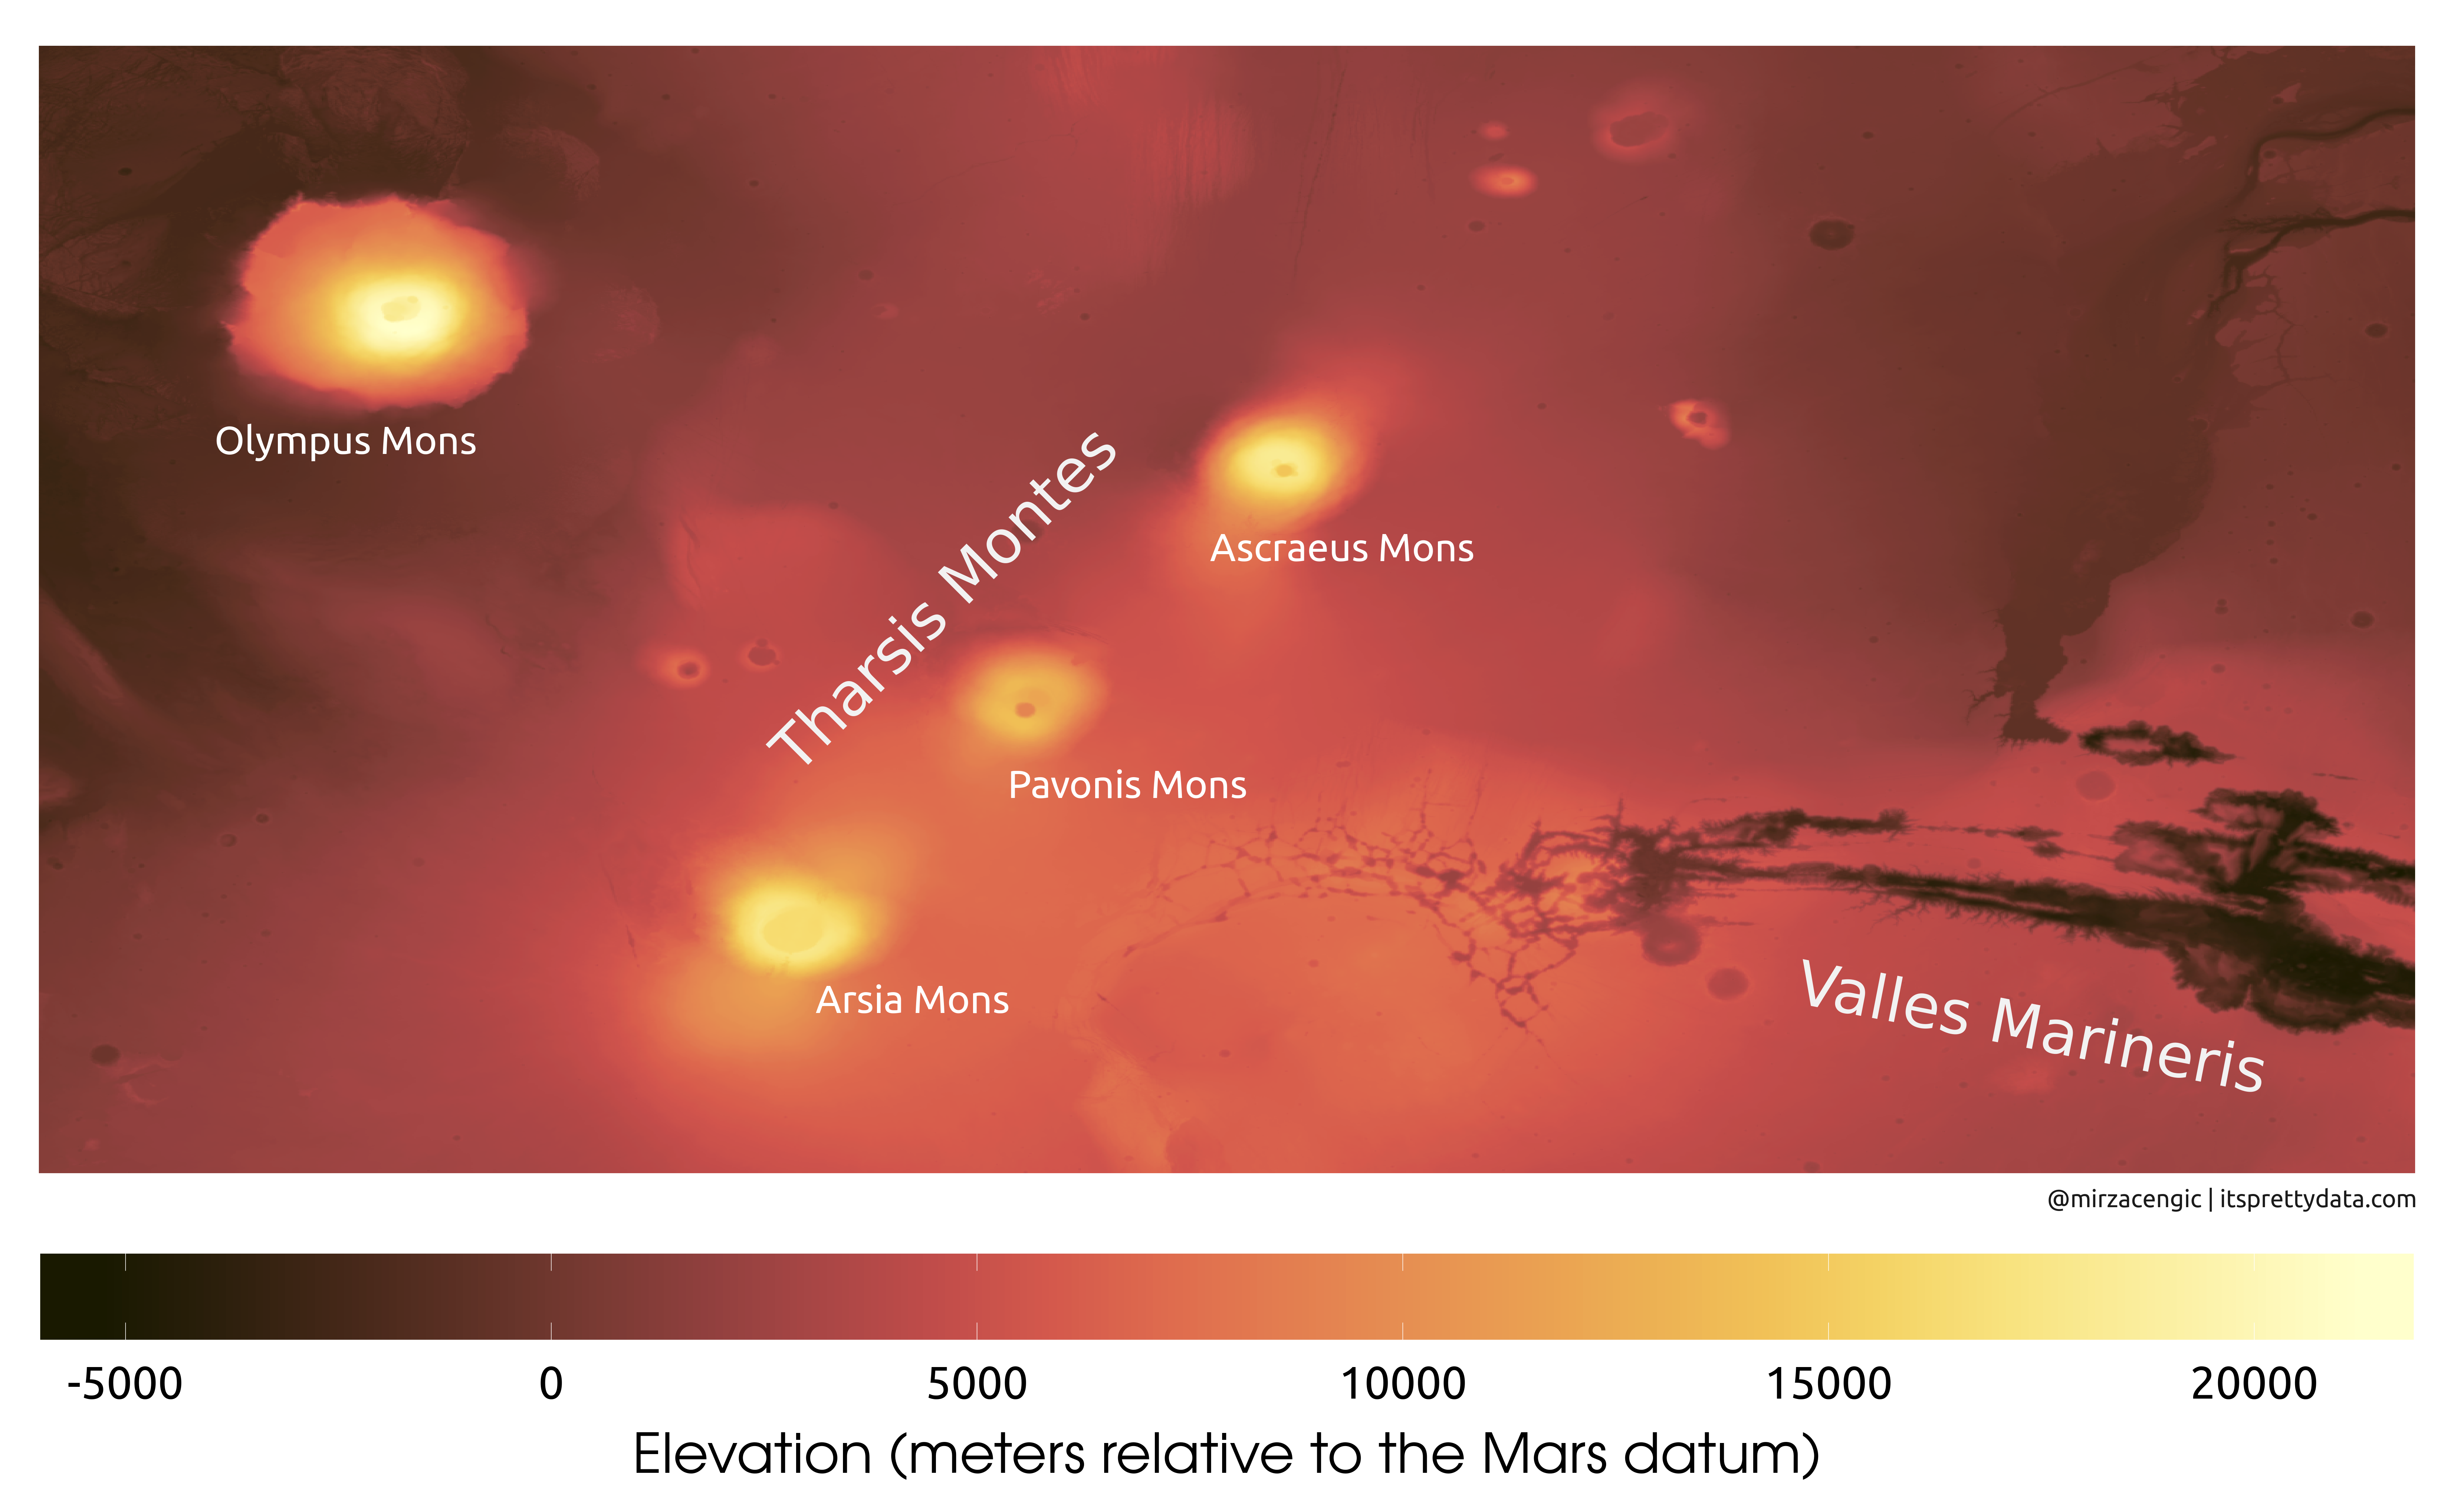
Day 7: Red
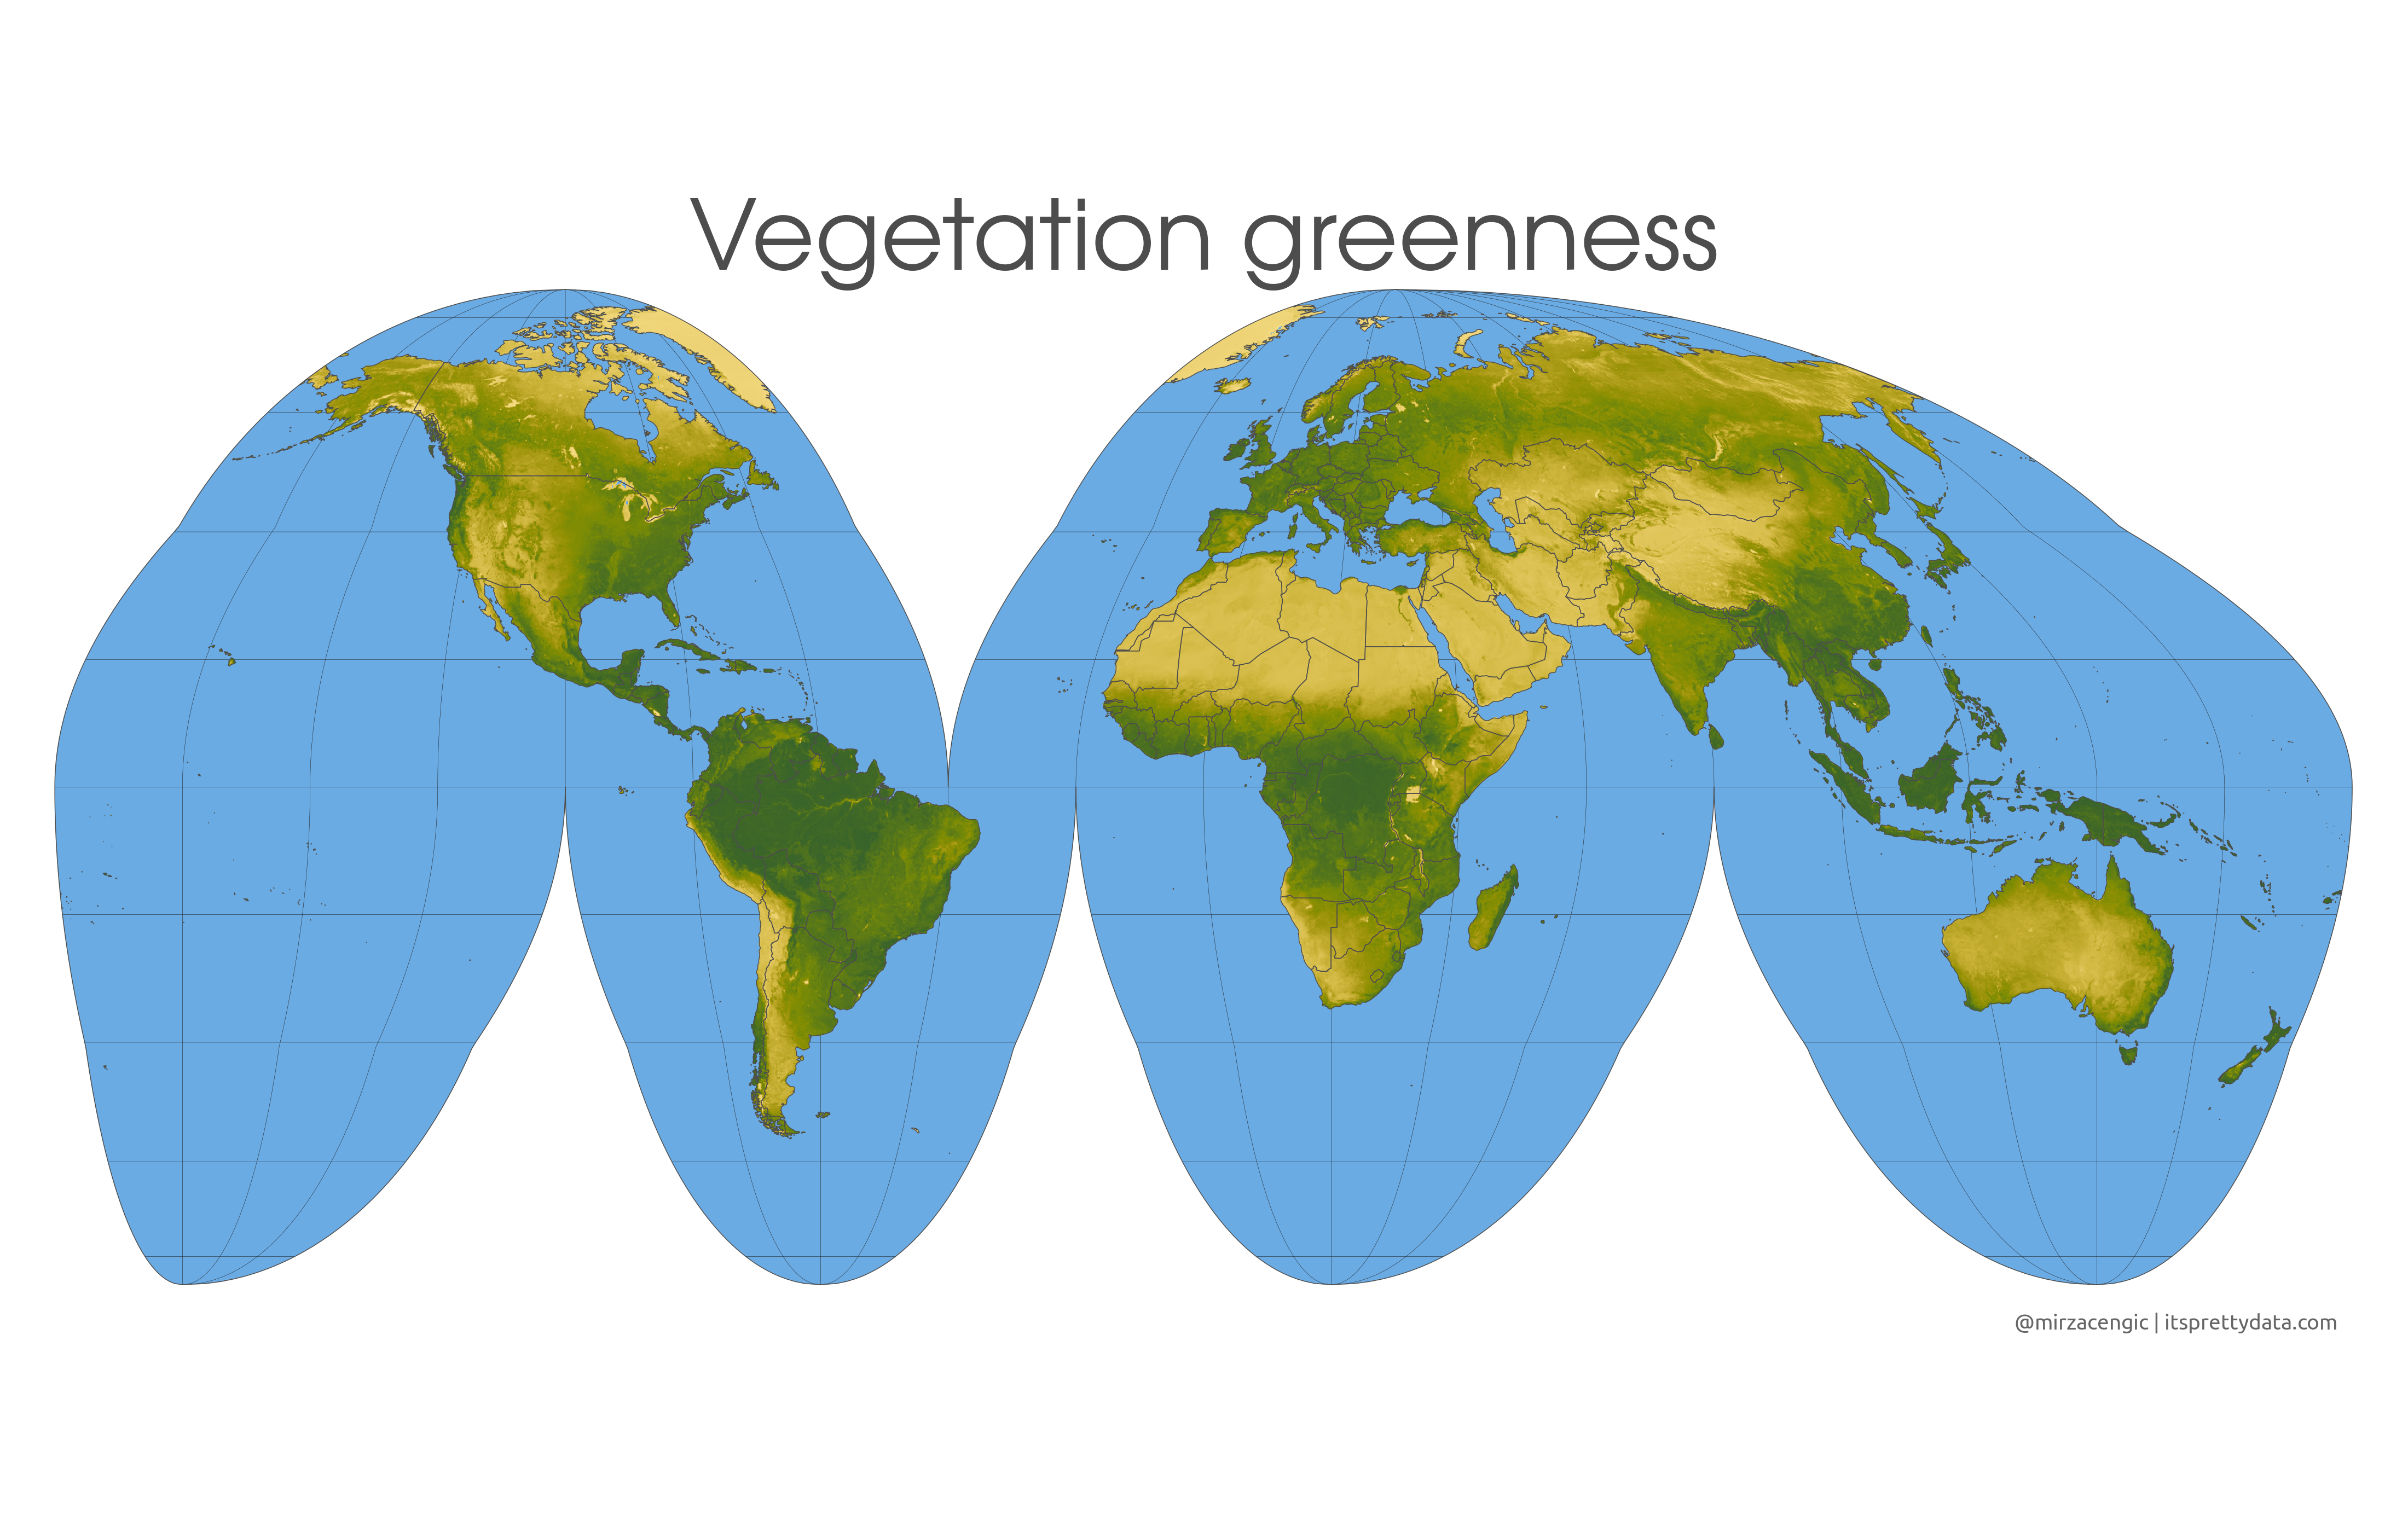
Day 8: Green
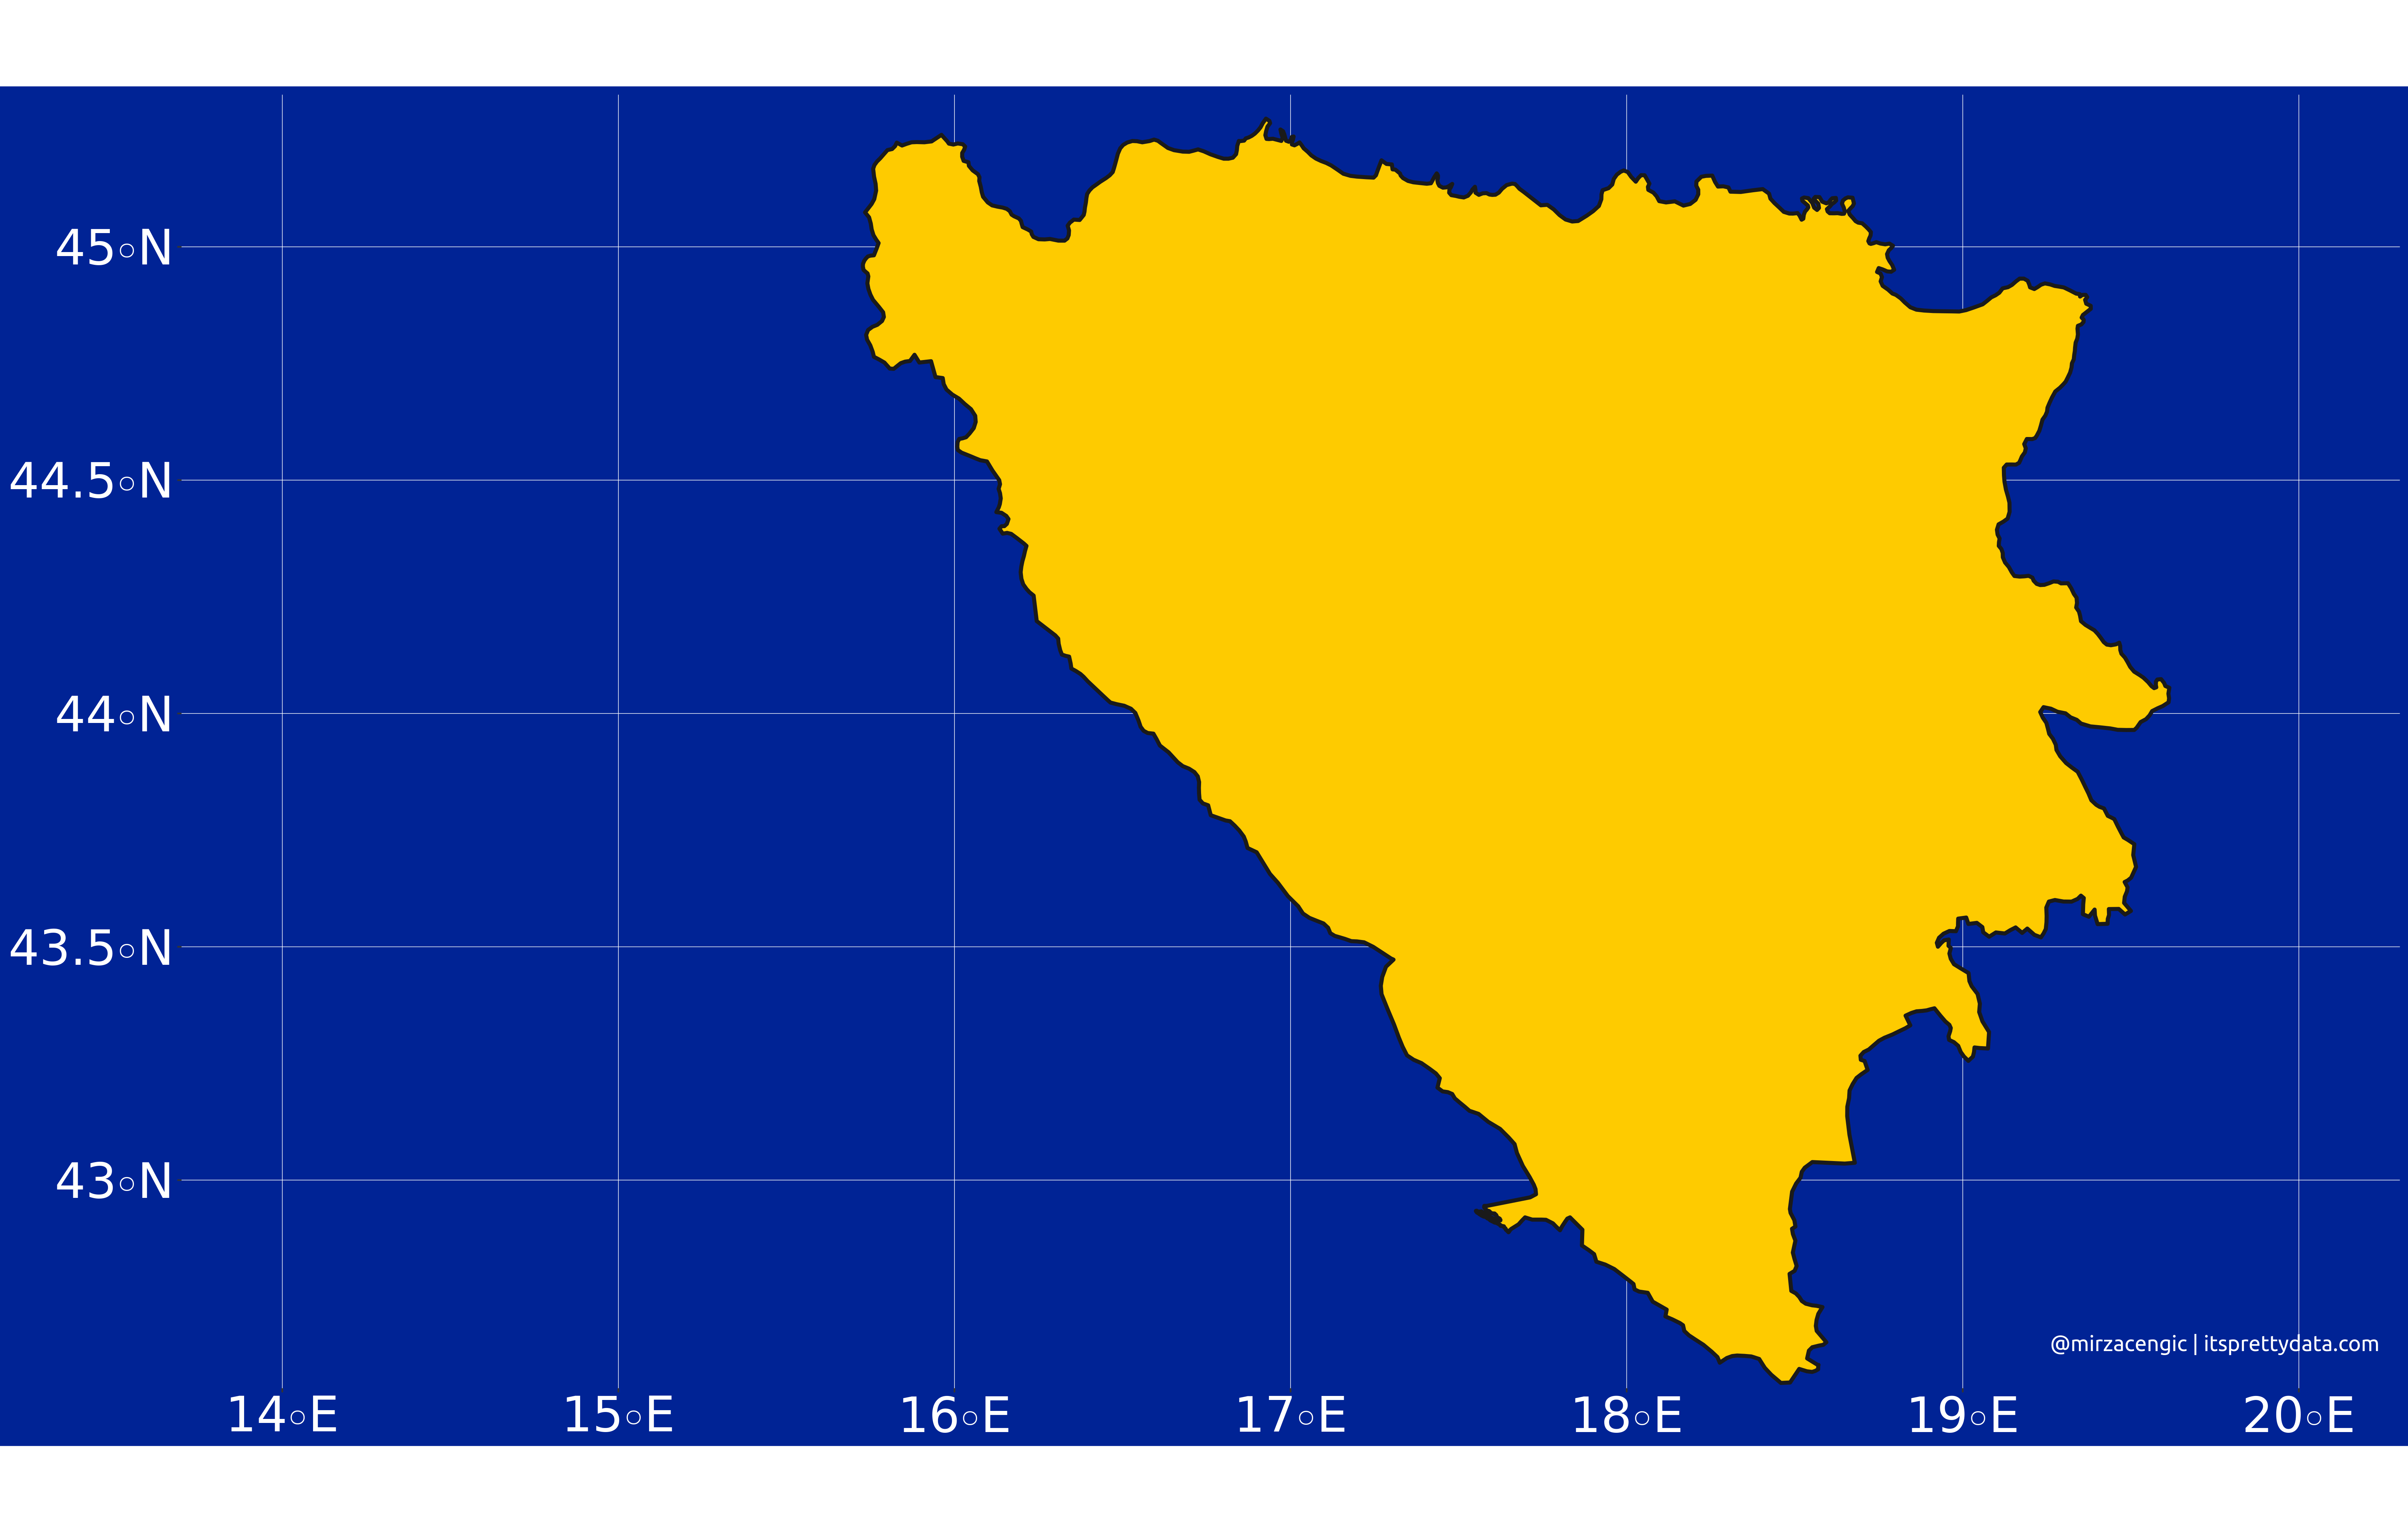
Day 9: Yellow
Day 10: Black and White
